[ad_1]
 Photo source
Risk comes from not knowing what you are doing…
…that’s what Warren Buffett says. What’s more, he is right. The question is, do you really know what your US small-cap ETF is doing?
The “first choice” and most well-known small-cap index for many is the Russell 2000 Index. This index is used as a benchmark for many products with AUM of about $1.6 trillion. By far the largest for ETF tracking, iShares Russell 2000 ETF (IWM) is very popular, with about $43 billion AUM.
However, instead of Russell 2000, you could also use the less well-known S&P 600 Index, which uses a slightly more “complicated” or “sophisticated” approach to stock selection. Products that have this index as benchmark have less than $100 billion AUM, so the S&P 600 Index is not nearly as popular as Russell 2000. The dominant ETF-tracking S&P 600 Index is iShares Core S&P Small-Cap ETF (IJR), with about $44 billion AUM.
Nevertheless, there could also be a third, perhaps even “smarter” way. Both the previously mentioned indices/ETFs are market-cap weighted, but of course, this is not the only way to calculate an index. For instance, WisdomTree SmallCap Earnings ETF (EES) uses a different approach. The underlying index (WisdomTree U.S. SmallCap Earnings Index) weights its components by earnings. So, which one of these ETFs is the best?

Table 1 shows some basic information about all three ETFs. As you can see, IWM and IJR have almost the same AUM. However, the trading volume of IWM is much bigger. EES is by far the smallest and least-traded ETF, but it is still large enough.
Table 1: IWM, IJR, ESS; source: iShares; WisdomTree; ETF.com
|
iShares Russell 2000 ETF (IWM) |
iShares Core S&P Small Cap ETF (IJR) |
WisdomTree U.S. SmallCap Earnings ETF (EES) |
|
|
Benchmark |
Russell 2000 Index |
S&P 600 Index |
WisdomTree U.S. SmallCap Earnings Index |
|
AUM |
$41.9B |
$43.4B |
$731.1M |
|
Average Daily $ Volume |
$2980M |
$325.4M |
$3.6M |
|
Average Spread |
0.01 % |
0.01 % |
0.19 % |
|
Expense ratio |
0.19 % |
0.07 % |
0.38 % |
|
Distribution Yield |
1.28 % |
1.70 % |
1.84 % |
|
Index components selection methodology |
Market cap |
Committee/specific inclusion criteria; earnings |
Specific inclusion criteria; earnings |
|
Index weighting methodology |
Market cap |
Market cap |
Modified capitalization: earnings |
|
Number of holdings |
2008 |
603 |
862 |
|
Top10 weight |
2.96 % |
5.22 % |
8.49 % |
|
Inception |
May 2000 |
May 2000 |
February 2007 |
The most important thing, however, is how their underlying indices work, so let’s look at that…
It is all about earnings…
As I wrote earlier, the Russell 2000 Index uses the simplest, easiest – or whatever word you choose – approach to stock selection and to determining their weights.
It all starts with the broadest Russell 3000E Index, which consists of about 4,000 US stocks sorted/weighted by their market cap (float-adjusted; most indices use this metric). Stocks trading below $1 and OTC stocks are excluded. This index represents about 99-100% of the whole US stock market. Then, Russell divides this base index into multiple subindices. Hence, for instance, companies in ranks #1 – #1,000 are part of Russell 1000, representing large caps. What is more important to us, companies in ranks #1,001 – #3,000 are part of Russell 2000. Once again, companies are weighted by market cap, so the largest one has the biggest weight.
Basically, all a company needs to become part of Russell 2000 is a) to be a US company and b) to have a market cap in the appropriate range. That’s all. However, all this also means something else. About one-third of the companies in Russell 2000 are unprofitable. This is no surprise, since it is relatively common for small-cap companies in the early stages to burn cash that they need for future development (consider, for instance, biotech companies). Because the Russell Index does not use any conditions based on profit, unprofitable companies are, of course, part of this index and therefore also part of the IWM portfolio.
The S&P 600 Index uses a different approach. To become part of the S&P 600 Index, companies need to meet, among other things, certain performance requirements. Basically, there is a committee that decides whether a company should become part of the S&P 600 Index or not. However, of course, they cannot just do what they want. There are strict rules. Firstly, logically, all constituents must be US companies. It is a small-cap index, so all companies must have an unadjusted market of $450 million to $2.1 billion (at least according to current information). However, the most important thing is that “all companies must have positive as-reported earnings over the most recent quarter, as well as over the most recent four quarters (summed together).”
Simply put, companies in the S&P 600 Index must be not only from the US and small enough to qualify, but also must be profitable. That is a big difference compared to the Russell 2000 Index. There are, of course (and also in the Russell case), some other criteria related to liquidity, but these are not important. What is important is that once the companies are chosen as part of the S&P 600, they are weighted by their (float-adjusted) market cap – once again, the biggest company has the biggest weight, and so on. If you want something that goes a step further, the WisdomTree U.S. SmallCap Earnings Index comes into play.
In this case, it all once again starts with a border index, this time the WisdomTree U.S. Earnings Index. To become part of this index, the company must be listed in the US, have a market cap of at least $100 million and meet some liquidity requirements, but more importantly, “component companies need to have had a P/E ratio of at least two, as of the screening date.”
The WisdomTree U.S. SmallCap Earnings Index (the benchmark of EES) is then created based on a defined percentage of the remaining market capitalization of the WisdomTree U.S. Earnings Index, once the 500 largest companies by market capitalization have been removed. The companies that comprise the bottom 25% of the remaining market capitalization are selected for inclusion in the small-cap index. It is also important that, in this case, companies that are part of the small-cap index are not market weighted, but rather modified capitalization weighted. This means that:
“The initial weight of a component in the index at the annual reconstitution is based on the companies’ earnings stream during the last four fiscal quarters. To calculate the weighting factor – earnings stream – WisdomTree uses cumulative earnings generated over the prior four reported quarters, as of November 30th of each year. Thus, each component’s weight in the index at the “weighting date” (defined below) reflects its share of the total earnings stream recorded over the prior four quarters by all of the component companies in the index.”
In other words, more profitable companies also have higher weights. There are, of course, some limits that are used to prevent one company from having too much weight. These can be found in the methodology list.
Therefore, we have three different approaches that are used by three different indices/ETFs to build their portfolios. But what does it all mean in practice? Well, as you can see from chart 1, not only do all ETFs have a different number of companies in the portfolio with different average market caps, but there are also big differences in sector composition.
Chart 1: Sector allocations; source: iShares; WisdomTree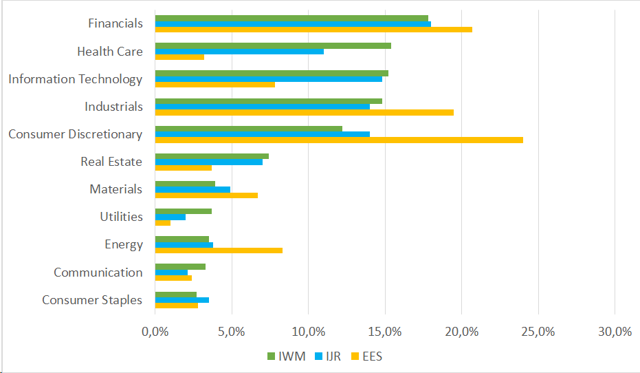
Once again, the differences in sector composition are not a result of overweighting or underweighting this or that sector. They are simply the result of different stock selection criteria.
Let’s take the healthcare sector as an example. There are many companies in the healthcare sector listed on the US stock exchanges. So if the only criterion is the size of the company, the healthcare sector will form a large part of the given index, as it does in the Russell 2000 Index. Biotech companies are an essential part of the healthcare sector. However, many small-cap biotech companies are in the early stages of drug development – they are not profitable. Therefore, if you use some profit criterion to decide if this or that company should be part of an index, many companies will not pass, and so the weight of the healthcare sector will be lower. Furthermore, if you weight companies according to profit, the whole weight of such a sector will be even smaller, as can be seen in chart 1.
It is clear that there are big differences between IWM, IJR, and EES. By using the ETF Research Center’s Overlap Analysis tool, we can see that these ETFs have only 35% or 29% of holdings in common by weight (measuring the overlap between IWM and IJR and between IWM and EES, respectively).
How does this all affect the return and volatility of IWM, IJR, and EES?
It is said that one chart is worth more than a thousand words, so let’s look at charts 2-6, which show the return and volatility at 1Y, 3Y, 5Y, and 10Y and since the inception (of the EES) period.
Chart 2:1Y period; source:etfreplay.com
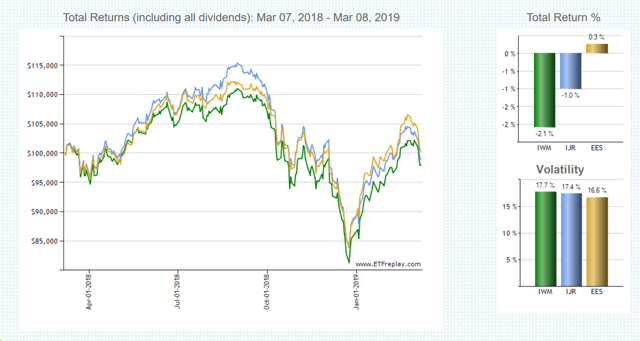 Chart 3: 3Y period; source: etfreplay.com
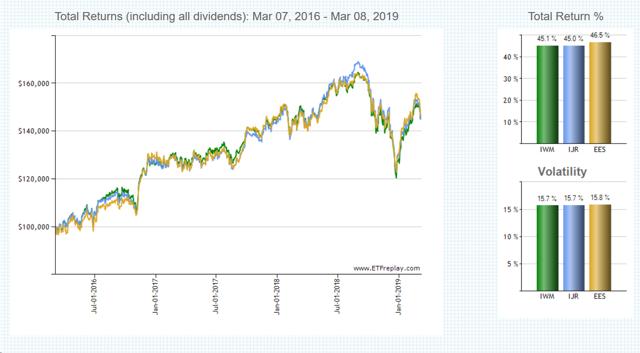
Chart 4: 5Y period; source: etfreplay.com
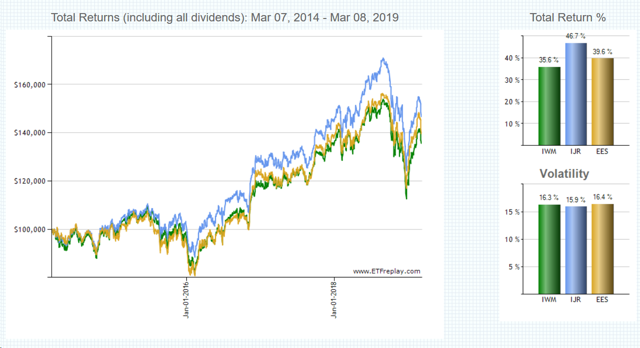
Chart 5: 10Y period; source: etfreplay.com
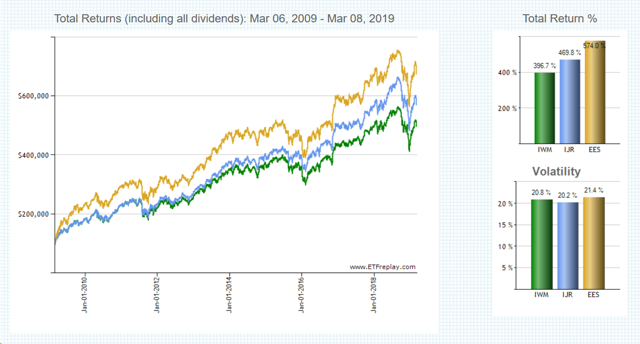
Chart 6: Since inception (of EES) period; source: etfreplay.com
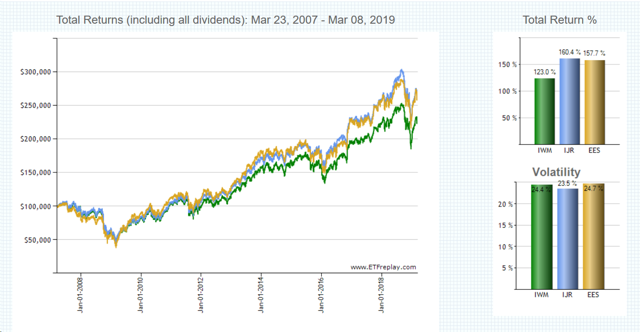
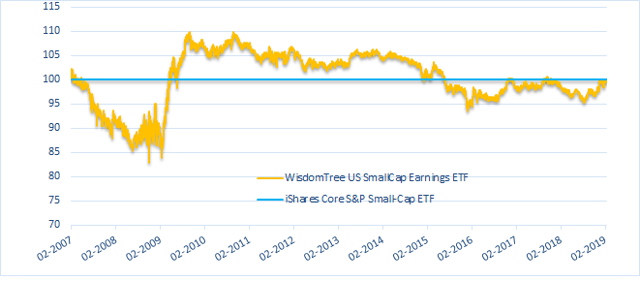
You can see that IWM underperforms (with the same volatility) in basically all the chosen periods. However, the difference between IJR and EES is not so clear. It depends on what period you choose. In this case, it could be useful to look at chart 7, which puts the whole thing into the relative perspective, measuring how IJR and EES are performing relative to IWM. What does this mean? Well, IWM is represented by the green line at 100, IJR is represented by the blue curve and EES by the orange curve. When the curve moves upward, it means that IJR or EES is outperforming IWM (has better gains or lower losses). In contrast, if the curve is moving downward, it means that IJR or EES is underperforming compared to IWM (has worse gains or bigger losses).
Chart 7: Relative performance (IJR and EES relative to IWM); source: iShares; WisdomTree; own calculations
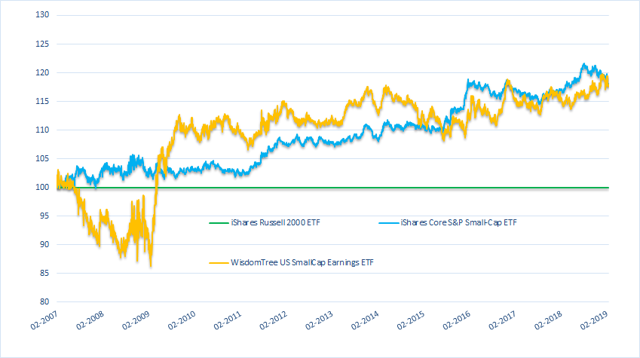 For most of the time, IJR and EES both outperform IWM. One could say that EES is slightly riskier, because it underperforms in times of financial crisis, but on the other hand, after the bounce from the bottom, EES outperformed the others significantly for a while. To give another perspective, chart 8 shows the yearly performance of all three ETFs. You might also consider chart 9, which shows the performance of EES relative to IJR. As you can see, outside the period of financial crisis, the performances are fairly similar. So, which ETF is the best?
Chart 8: Yearly performance; source: iShares; WisdomTree; own calculations
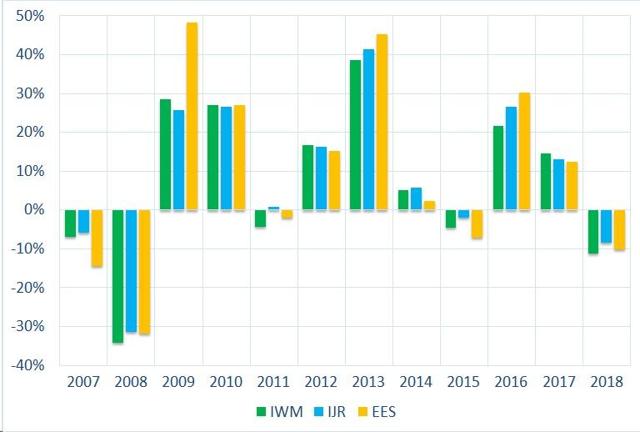 Chart 9: Relative performance (EES relative to IJR); source: iShares; WisdomTree; own calculations
It is not so easy to say. IWM offers the broadest portfolio and the highest liquidity; however, over the long-term period, it underperforms. Therefore, if you are a long-term investor, I do not see much reason to stay in IWM. There were, of course, some (short) periods when IWM outperformed the other two ETFs, but the question is, is it possible to time the market? I do not think so.
The choice between IJR and EES is much more complicated. Both ETFs are going in the same direction (using profit as an inclusion criterion), but we could say that EES takes it a step further. However, this does not mean that EES is always more profitable. I would say that both these ETFs are a good choice. EES is a bit “smarter,” so if you like such an approach, choose EES. If you are afraid that something like a financial crisis will soon occur, IJR seems to be somewhat safer. IJR is also cheaper and the daily volume is much larger. Either way, given what EES offers, I think it is safe to say that this ETF deserves much more attention.
Disclosure: I/we have no positions in any stocks mentioned, and no plans to initiate any positions within the next 72 hours. I wrote this article myself, and it expresses my own opinions. I am not receiving compensation for it (other than from Seeking Alpha). I have no business relationship with any company whose stock is mentioned in this article.
Additional disclosure: Disclaimer: Please always do your own due diligence to reach your own conclusions.
[ad_2]
Source link Google News

