[ad_1]

SCHY – In search of international high dividends
Nikolay Pandev/E+ via Getty Images
(This article was co-produced with Hoya Capital Real Estate.)
In my most recent article for Seeking Alpha, I covered Vanguard International High Dividend Yield ETF (VYMI). I concluded that, with the exception of a possible contrarian gamble, one could likely do better elsewhere.
In the comments section, a reader asked “What do you think about SCHY?” Another reader responded to the effect that they liked this ETF very much but, since it was a relative newcomer to the marketplace, they felt like they wanted to allow a little more time to see how it performed. However, they called out the fact that it was constructed very much like SCHD, and this gave them a basis for optimism.
The ETFs being referred to in the above comments are Schwab International Dividend Equity ETF (SCHY) and Schwab U.S. Dividend Equity ETF (SCHD). As it happens, I recently gave SCHD a glowing review and, while I don’t currently hold it in my personal portfolio, I will disclose that I am watching for a good opportunity to establish an opening position.
Since I have not yet reviewed SCHY, based on that reader interaction, I decided it was high time I did so. Further, since SCHY is a fairly new ETF, and does not yet have a long record of performance, I will make reference to both SCHD and VYMI as comparison points. In so doing, I hope to help readers come to some conclusion as to whether you feel it is an ETF you may wish to add to your portfolio right now.
Introducing – Schwab International Dividend Equity ETF
First, some high-level data. With an inception date of 4/29/2021, SCHY is a relatively new ETF. At the same time, its sibling SCHD was established on 10/20/2011, thus recently celebrating its 10th anniversary. Why may this be relevant? Because SCHY’s selection methodology basically mirrors that of SCHD. As a result, SCHD’s consistently excellent performance might be taken as a harbinger of how SCHY may perform.
SCHY has an expense ratio of .14% and, at least at the present time, a relatively high trading spread of .10%. Please also notice that, while SCHD features quarterly dividend distributions, SCHY has semi-annual distributions. Some investors may view this as a slight negative.
Next, let’s start to get into the nitty gritty, so to speak. Since this is a relatively new ETF, and the first time I have reviewed it, I am first going to share a decent amount of information from SCHY’s summary prospectus. Next, I will share some graphics that should help you visualize how this all plays out in the real world. Finally, I am going to do brief comparative sections featuring both VYMI and SCHD, so you can try to get some sense as to how SCHY may perform moving forward.
To begin, then, here is some key information from SCHY’s summary prospectus. I will edit it for length, as well as try to present it in a slightly more readable format. However, feel free to review the document for yourself using the handy link provided above.
The fund generally invests in stocks that are included in the Dow Jones International Dividend 100 Index. The index is designed to measure the performance of high dividend yielding stocks issued by companies in developed and emerging countries outside the United States.
To be included in this index, stocks must have sustained at least 10 consecutive years of dividend payments, have a minimum market capitalization of $500 million USD initially ($400 million USD for those stocks already in the index at reconstitution) and must meet minimum liquidity criteria.
Next, eligible stocks are ranked based on four fundamental characteristics:
- Cash flow to total debt
- Return on equity
- Indicated dividend yield
- 5-year dividend growth rate
From the total index, the list is winnowed to the top 400 highest ranked securities by composite score. A volatility screen is then applied to those 400 highest ranked securities, from which the 100 securities with the lowest volatility are included in the index.
No single stock can represent more than 4.0% of the index, no single sector can represent more than 15% of the index, and stocks from countries identified as emerging markets by the index provider cannot represent more than 15% of the index. The index composition is reviewed annually and rebalanced quarterly.
Under normal circumstances, 80% of the fund’s net assets will be invested in these securities. Interestingly, the fund may invest up to 20% of its net assets in securities not included in the index. Among other things, this gives the investment adviser flexibility to sell securities that are represented in the index in anticipation of their removal from the index, or buy securities that are not yet represented in the index in anticipation of their addition to the index. As a result, while the “official” reconstitution process takes place annually, the managers reserve the right to a little wiggle room to exercise discretion to buy and sell on other occasions if they believe circumstances warrant this.
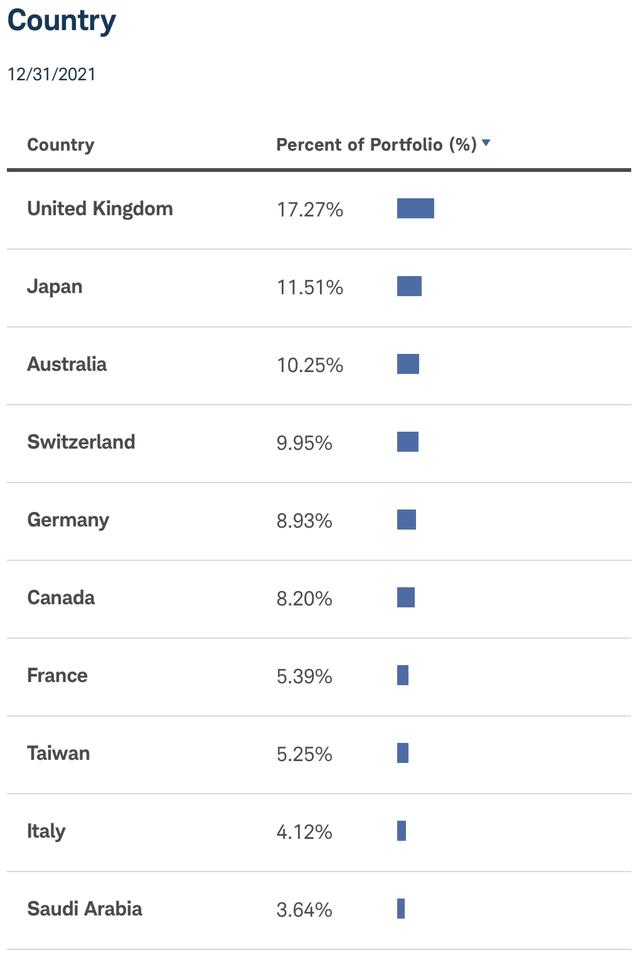
How does all of this play out in practice? We’ll take a look at this in the next 2 graphics. This first one, from Schwab’s website for SCHY, gives the breakdown by country.

SCHY – Country Breakdown (Schwab SCHY Website)
In total, the countries you see in that list comprise some 84.51% of the fund.
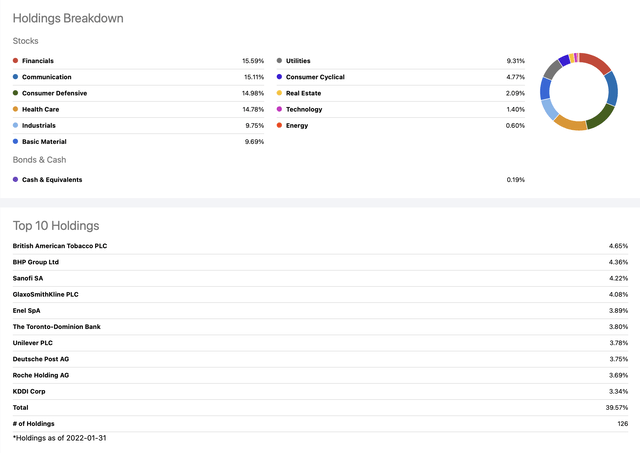
Next, a nice combination graphic from Seeking Alpha showing SCHY’s sector breakdown as well as Top 10 holdings.

SCHY Sector Breakdown and Top 10 Holdings (Seeking Alpha)
Per the above graphic, these 10 companies comprise virtually 40 cents of every dollar invested in SCHY. As a result, I decided to take the time to provide a thumbnail overview on each company.
- British American Tobacco p.l.c. (BTI) – Provides tobacco and nicotine products to consumers worldwide.
- BHP Group Limited (BHP) – Operates as a resources company in Australia, Europe, China, Japan, India, South Korea, rest of Asia, North America, South America, and internationally.
- Sanofi (SNY) – Engages in the research, development, manufacture, and marketing of therapeutic solutions in the United States, Europe, and internationally.
- GlaxoSmithKline plc (GSK) – Engages in the creation, discovery, development, manufacture, and marketing of pharmaceutical products, vaccines, over-the-counter medicines, and health-related consumer products in the United Kingdom, the United States, and internationally.
- Enel SpA (OTCPK:ENLAY) – Operates in the electricity and gas sectors worldwide. The company generates, transmits, distributes, purchases, transports, and sells electricity; transports and markets natural gas; supplies LNG; and designs, develops, constructs, operates, manages, and maintains generation plants and transmission grids.
- The Toronto-Dominion Bank (TD) – Provides various financial products and services in Canada, the United States, and internationally.
- Unilever PLC (UL) – Operates as a fast-moving consumer goods company in Asia, Africa, the Middle East, Turkey, Russia, Ukraine, Belarus, the Americas, and Europe. It operates through Beauty & Personal Care, Foods & Refreshment, and Home Care segments.
- Deutsche Post AG (OTCPK:DPSTF) – Operates as a mail and logistics company in Germany, rest of Europe, the Americas, the Asia Pacific, the Middle East, and Africa.
- Roche Holding AG (OTCQX:RHHBY) – Engages in the prescription pharmaceuticals and diagnostics businesses in Switzerland, Germany, and internationally.
- KDDI Corp (OTCPK:KDDIY) – Provides telecommunications services in Japan and internationally.
While SCHY has, for example, a far smaller subset of constituents than VYMI, and a much higher concentration in its top holdings, the above list features the diversity of not only business sectors, but geographical scope, of the solid blue-chip international stocks found in this ETF.
VYMI – Quick Comparative Notes
Before briefly highlighting some differences in the holdings of SCHY and VYMI, I want to call out a fairly substantial difference in expense ratios. With an expense ratio of .14%, SCHY sharply undercuts VYMI’s .28%. Obviously, this means that VYMI has to outperform SCHY by .14%, each and every year, to provide the same net return to investors.
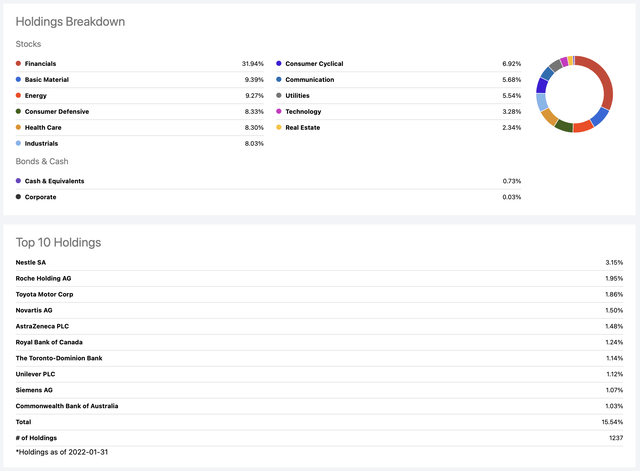
With that said, let’s take a minute to see how SCHY’s profile compares to VYMI, using the same combo graphic from Seeking Alpha.

VYMI Sector Breakdown and Top 10 Holdings (Seeking Alpha)
As can be seen, VYMI is far more diversified with respect to total companies included by a factor of roughly 10-to-1, with some 1,237 companies displayed in the graphic above compared to 126 for SCHY.
Not surprisingly, then, VYMI’s Top 10 holdings comprise a much smaller percent of the total, at 15.54% vs. SCHY’s 40.76%.
With respect to the sector weightings, SCHY is far more balanced than is VYMI. One of the concerns I called out in my previous article on VYMI was that Financials and Energy comprise some 41.21% of the fund! This was a much higher weighting, for example, than a top-quality total-market international ETF I compared it against.
In contrast, SCHY contains a much more balanced 15.59% weighting in Financials, and very little exposure to Energy. What sectors make up the difference? I found that it is primarily Communications, Consumer Defensive, and Health Care.
SCHD – Quick Comparative Notes
As mentioned at the outset of the article, SCHY’s selection methodology basically mirrors that of SCHD.
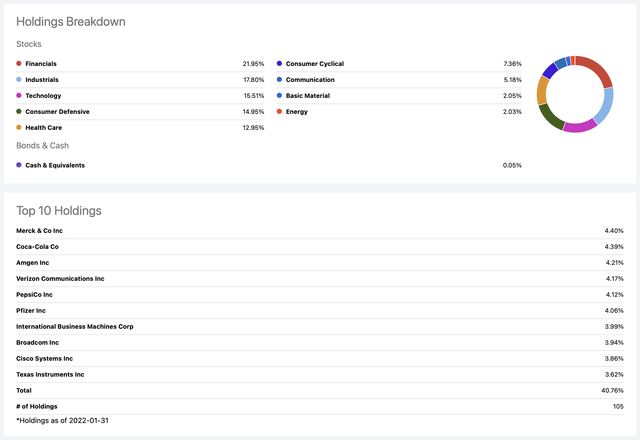
Let’s take just a minute, then, to see how SCHY’s profile compares to SCHD.

SCHD Sector Breakdown and Top 10 Holdings (Seeking Alpha)
First of all, some similarities. Perhaps not surprisingly, given that both ETFs are comprised of roughly 100 market-weighted securities, the % of holdings comprised by the Top 10 are very similar; 39.57% in the case of SCHY and 40.76% in the case of SCHD.
Another similarity is that the top 5 or 6 sectors are very nicely balanced in both funds, no one sector has a tremendous overweighting.
However, within the sectors, there are a couple of fairly large divergences. The one that really jumps out at me is Technology. Even though SCHD is a fairly conservative, value-oriented ETF, Technology still manages to score a 15.51% weighting here. In contrast, SCHY has a scant 1.40% weighting in this sector.
Most of this, it appears, is made up of Utilities. In SCHD, Utilities are not even called out as a sector whereas they comprise 9.31% of SCHY. Financials and industrials are also more heavily weighted in SCHY.
Summary and Conclusion
Even though it is a relatively new ETF, I find much to like about SCHY. In fact, I am going to go out on a limb and make it my preferred selection over VYMI. Here are my reasons.
- As previously featured, its expense ratio of .14% is exactly half that of VYMI.
- While VYMI might be argued to be more diversified due to its significantly larger number of holdings, I believe SCHY’s far more stringent filters for inclusion may keep the quality of its holdings at a higher level.
- In terms of sector balance, SCHY is more evenly-weighted across multiple sectors, as opposed to VYMI’s 41.21% allocation to just Financials and Energy.
One small negative might be that SCHY only pays dividends semi-annually. Both its sibling SCHD and competitor VYMI pay on a quarterly basis.
I hope you have found this article enlightening.
As always, until next time, I wish you…
Happy investing!!
[ad_2]
Source links Google News

