[ad_1]
Schwab U.S. REIT ETF (SCHH) tracks the performance of U.S. based real estate investment trusts with one of the lowest expense ratios in the industry at just 0.07% which is one of the main marketing points that has helped this ETF grow to reach $5.4 billion in total assets under management. SCHH is an overall good choice for investors that seek passive exposure to the sector, although there are a couple of considerations in comparison to some of the other larger and well known REIT ETF alternatives. This article highlights the characteristics of the Schwab U.S. REIT ETF along with a review of its recent performance while providing forward looking commentary for REITs for the year ahead.
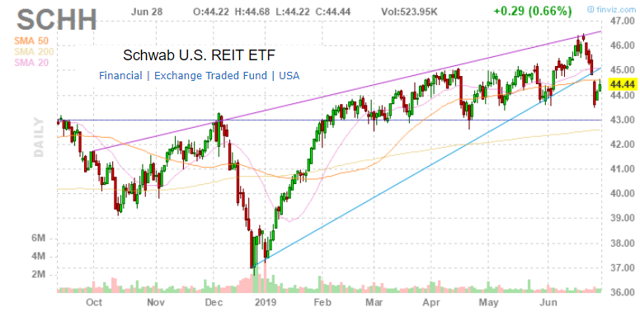
SCHH price chart. Source: FinViz.com
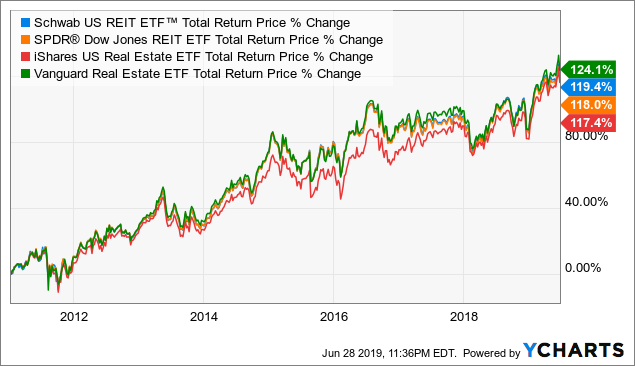
SCHH’s performance since its January 2011 inception date has largely tracked REIT sector benchmarks with a total return of 120% over the period or approximately 10% per year. This is broadly in line with other U.S. REIT ETFs including: the Vanguard Real Estate ETF (NYSE:VNQ), the iShares U.S. Real Estate ETF (NYSE:IYR), and the SPDR Dow Jones REIT ETF (NYSE:RWR). The differences here over the period are related to different tracking index methodologies while all have benefited from the same equity bull market and favorable environment of low interest rates for REITs in general.
 Data by YCharts
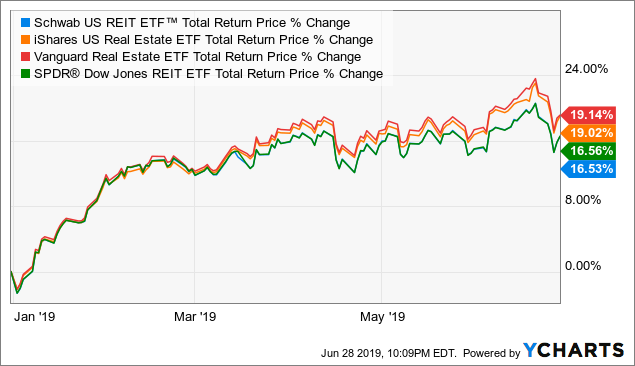
On the other hand, the data shows that SCHH has underperformed this same group over the past year. SCHH has returned 16.53% including dividends in 2019 compared to 19.14% for VNQ and 19.0% for IYR. This is explained by the Schwab ETF’s lack of exposure to a group of firms have been exceptionally strong over the last year. SCHH tracks the performance of the Dow Jones U.S. Select REIT Index. One of the features of this index is that it specifically excludes real estate investment trusts that are not technically real estate companies and whose performance is driven by factors other than real estate. This is important since a number of companies technically structured as a REIT could also be considered part of the tech or the communications sector. That’s the case of REITs like America Tower Corp. (AMT) and Crown Castle International Corp. (CCI) that own, operate and lease shared telecommunications infrastructure like cell phone towers. Equinix Inc. (EQIX), a provider of data center services, is another example of a strong performing REIT this year not included in the Schwab or SPDR Dow Jones REIT ETF.
 Data by YCharts
These companies meet the regulatory requirements like distributing 90% of taxable income and deriving 75% of revenue from real estate sources, but an argument can be made that their stock price performance is more of a function in trends in the telecommunications or technology sector. The point is that AMT, CCI, EQIX along with other smaller “tech REITs” have been big winners recently, presenting faster growth than the overall sector. AMT in particular is up 45% over the past year and has the largest weighting in VNQ at 7% of the fund. AMT and CCI combined represent 12.5% of IYR and 13% of VNQ.
The point here isn’t to say that one of these ETFs is better or worse than another but to help explain where the differences in returns this year are coming from. It’s worth noting that the possibility of weak returns from these cell tower and data center REITs going forward would make SCHH outperform in the future. Some investors may appreciate the lack of exposure in SCHH to companies that have potentially riskier business models outside traditional real estate.
SCHH Underlying Holdings
SCHH currently has 95 REIT holdings, with the top 50 presented below including total return performance figures. Including data from the full list of holdings, the median return for the underlying holdings year to date 2019 is 16.3%, reconciling the ETF’s return over the period. Only 10 stocks have a negative return this year. Still, despite the strong returns for the group this year, the average stock is still down 9.9% (median average) compared to their respective 52-week highs which in most cases came last year prior to the extreme market volatility observed in December 2018.
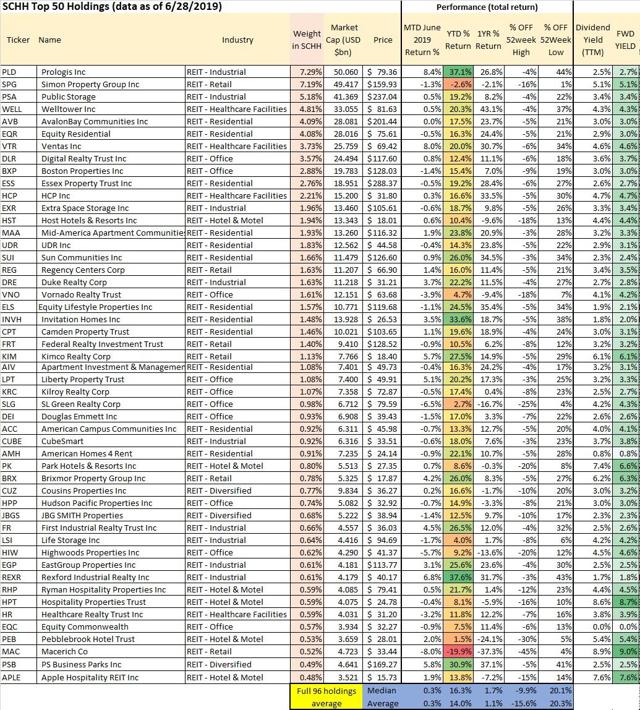
Underlying Holdings SCHH ETF. Source: data by YCharts/table author
Industrial REIT Prologis Inc (PLD) is the largest holding with a 7.29% weighting in the ETF and is also one of the top performers in the fund, up 37.1% in 2019. The company manages warehouse space that has benefited from the rise of e-commerce demand as part of the supply chain infrastructure. Amazon Inc. (AMZN) is one of its main tenants.
PLD along with Simon Property Group Inc (SPG), Public Storage (PSA), Welltower Inc. (NYSE:WELL), and AvalonBay Communities Inc. (AVB) are the top 5 holdings and together represent 28.56% of SCHH.
Retail REIT Macerich Company (MAC) operates malls which has been a particularly weak segment among REITs this year as the brick-and-mortar retail business including apparel stores and brands are challenged by declining store traffic as customers shop more online. MAC is down 19.9% in 2019 and a larger 45% from its 52-week high. The stock yields 9% on a forward basis but is relatively risky considering shares could still face more downside among weak trends in retail.
CBL & Associates Properties (CBL) has the smallest weighting at just 0.02% of the fund and presented the worst performance, down 46% in 2019 and 80% over the past year. This is another retail REIT that has struggled with the changing industry dynamic leading to declining tenant occupancy rates and falling income. The company recently suspended its dividend.
The wide range of returns highlights the value of the ETF in that it provides excellent diversification among passive exposure to the sector. An active investor that was underweight one of the big winners or overweight one of the losers likely underperformed the fund over these periods. SCHH is an overall good option to gain passive exposure to REITs, including some of the best and highest quality names in the sector.
Forward Looking Commentary
There is a growing consensus among market participants that we have entered the late stage of this equity cycle and some of the current themes confirm these suspicions. Concerns over not only global growth but emerging signs of a potential economic slowdown in the United States has driven a trend of investors moving into more “defensive” type sectors, including consumer staples, utilities, and REITs with a focus on cash flow and the quality of earnings. The Fed stepping in earlier this year by signaling a more dovish monetary policy has driven interest rates lower, fueling the yield advantage of income type stocks. Considering these dynamics, my view is that REITs in general are a crowded trade and expensive as a group.
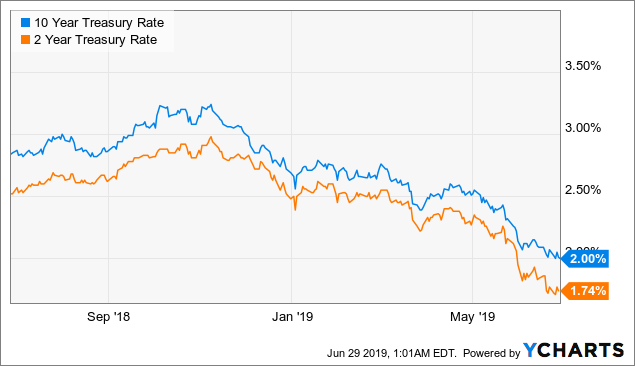 Data by YCharts
Falling interest rates are all-in-all positive to the cost of debt and the net interest income of many REITs, but the move lower here can only go so far to justify higher valuations for the group and the broader equity market in general. What I’d like to see is a a pickup of economic growth expectations with renewed momentum in indicators like employment and industrial production. A favorable resolution to the U.S.-China trade dispute could help with sentiment to drive the rally higher.
A deterioration in the economic outlook represents a risk to REITs in that even as they could still outperform the broader market, downside nevertheless would be significant in a recessionary type of environment.
Conclusion
My recommendation is to be more cautious on REITs and the Schwab U.S. REIT ETF at current levels is a “hold”. Investors could benefit by waiting for a pullback to add exposure or attempt to slowly build a position by averaging in at lower prices. Consider reading the fund prospectus for full risk disclosures.
Disclosure: I/we have no positions in any stocks mentioned, and no plans to initiate any positions within the next 72 hours. I wrote this article myself, and it expresses my own opinions. I am not receiving compensation for it (other than from Seeking Alpha). I have no business relationship with any company whose stock is mentioned in this article.
[ad_2]
Source link Google News

