[ad_1]
marchmeena29/iStock via Getty Images
Introduction
Investors have been pouring large amounts of capital into the Schwab US Dividend Equity ETF (NYSEARCA:SCHD) during Q1 of 2022 – more than the funds tied to the S&P, Dow, and NASDAQ combined. But is the investment community correctly positioning itself, regarding this ETF, concerning the macro headwinds set to accelerate in the second half of the year? After all, fickleness thy name is trader, and we’ve seen the community recently dog pile into thematic ETFs like the ARK Innovation ETF (ARKK), pushing them into bubble territory and then moving on to the next big thing in the end, letting them deflate back down into value territory, in classic market dynamical fashion.
At this point in the year, however, I believe traders are correct to HODL – aka hold on for dear life – this fund, for the following reasons:
Fed- and Rate-Hike-Related:
- It has done well under the most recent rate hike series (2016 to 2019).
- It performed slightly better than the broader market during the rate hike/taper tantrum scare of 2018 and is currently holding up better in the present one.
- Value tends to outperform growth in a higher interest rate environment.
- It has a roughly 20% position in financial-related stocks that have the cheapest valuations out of all the 11 sectors, secondary to the trauma of 2008, and that also stand to gain from higher interest rates.
Recession-Related:
- The fund is currently fairly valued (while the S&P continues to be overvalued).
- Dividend champions and aristocrats make up almost 30% of the fund’s equities by weighting.
- Value tends to do well versus growth (i.e. tech-heavy S&P 500) inside recessions, especially when commodity prices and short term Treasury yields (Fed fund rate) are are trending higher.
- It has a better-than-average guru focus safety score and low debt to E using my weighted average formula, which takes into account the relative weighting of each holding.
SCHD is a solid hold right now for those looking for yield and dividend growth. It’s the classic wonderful ETF at a fair price.
How Do Rate Hikes Affect SCHD?
During the rate hike sequence of 2016 to 2019, SCHD did what it was supposed to do: it threw off its safe 3 handle yield, hiked its dividend by 8.1% CAGR, and garnered some appreciation along the way for a total return of 16% CAGR. And this was in the low inflationary environment, where everyone was focused on growth and when the Invesco QQQ ETF (QQQ), or heck even the tech-heavy SPDR S&P 500 Trust ETF (SPY), was the place to be.
Seeking Alpha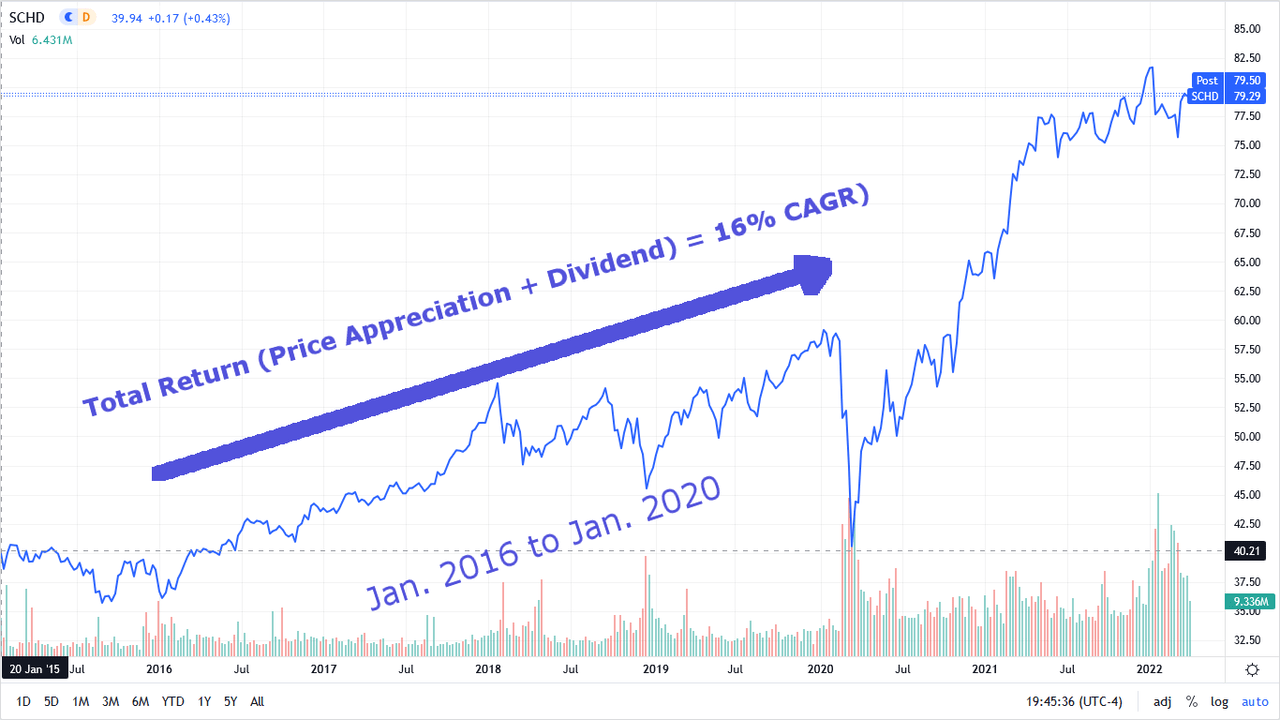
St. Louis Fed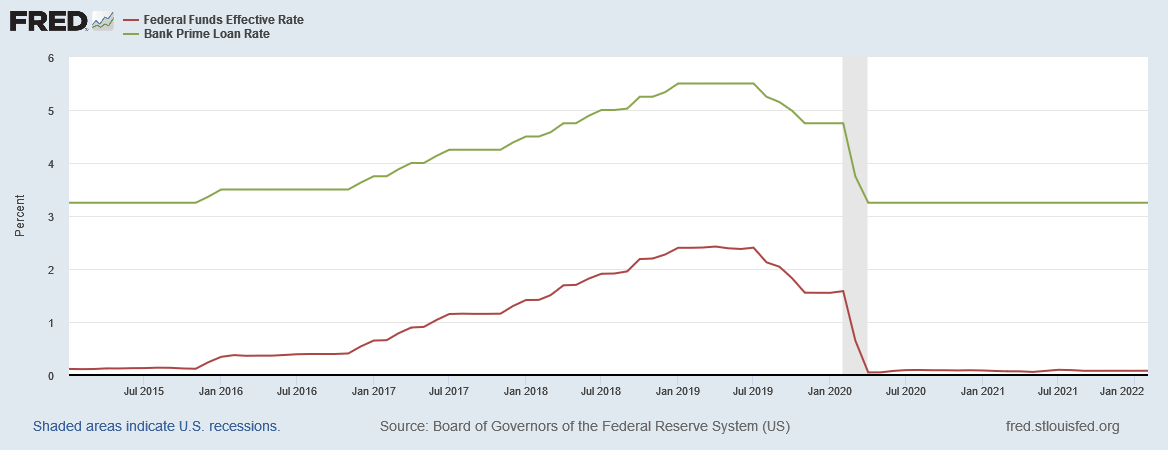
Indeed during the taper tantrum of Q4 2018 through Q2 of 2019, when traders weren’t enthusiastic about rate hikes and quantitative tightening happening in a concomitant fashion, SCHD’s drawdown was slightly better than the broader market:
JPM Asset Management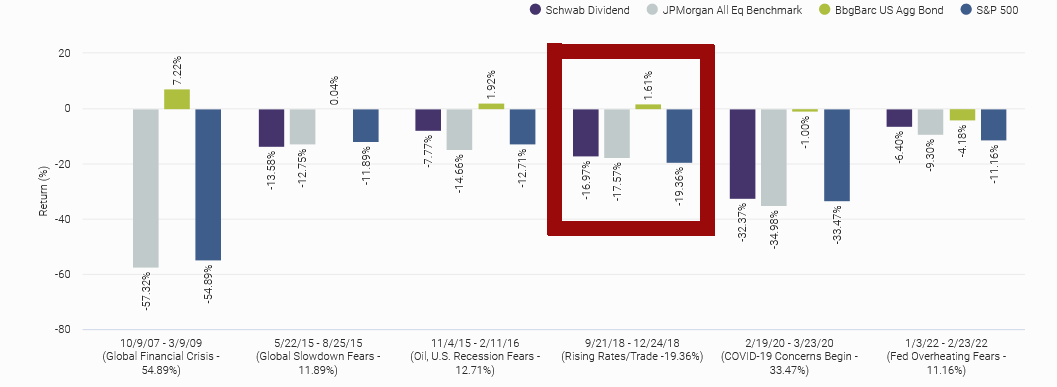
Incidentally it’s worth noting that of the five stress tests JPM lists for their notable drawdowns, four of them show SCHD performing at least slightly better than the broader market. And the latest of the set (1/3/22 to 2/23/22) shows SCHD significantly less affected by sentiment around inflation and rate hikes.
Value Performs Better Than Growth In a Rate Hike Environment
I’m likely preaching to the choir at this point, but just in case you’re new around here, capital tends to rotate from growth to value, at the start of a rate hiking series, and can continue doing so up to 18 months into the campaign.
S&P Global explains how increased increased rates, and costs of capital, pressure discounted cash flow calculations downward:
Higher interest rates would reduce the value of a company’s future cash flows and its overall value today. That is likely bad news for growth stocks — defined by measures such as sales growth — that promise greater returns in the future. Meanwhile, a high-rate environment tends to have less of an impact on value stocks such as financials and energy, since those companies are typically defined by their ability to generate profits today.
We can see this in action looking at iShares S&P 500 Value ETF (IVE) versus iShares S&P Growth ETF (IVW) in the early 2000s before the banksters took us down:
Seeking Alpha St. Louis Fed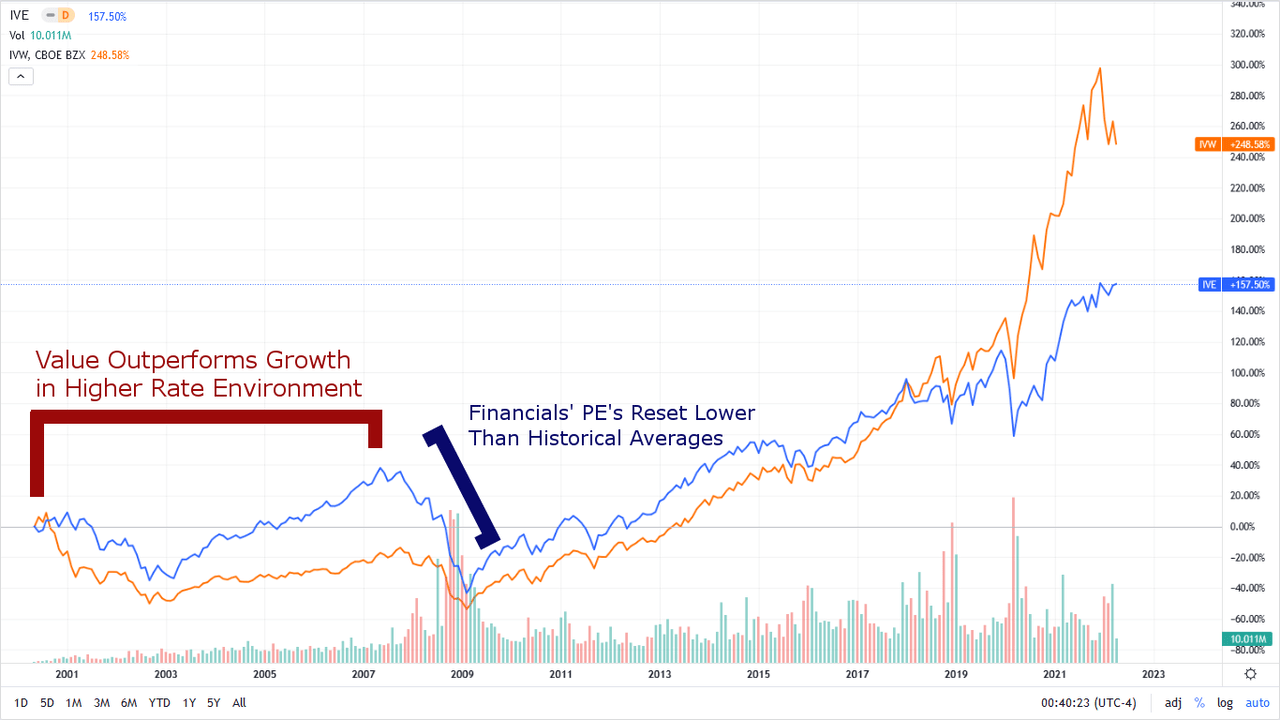
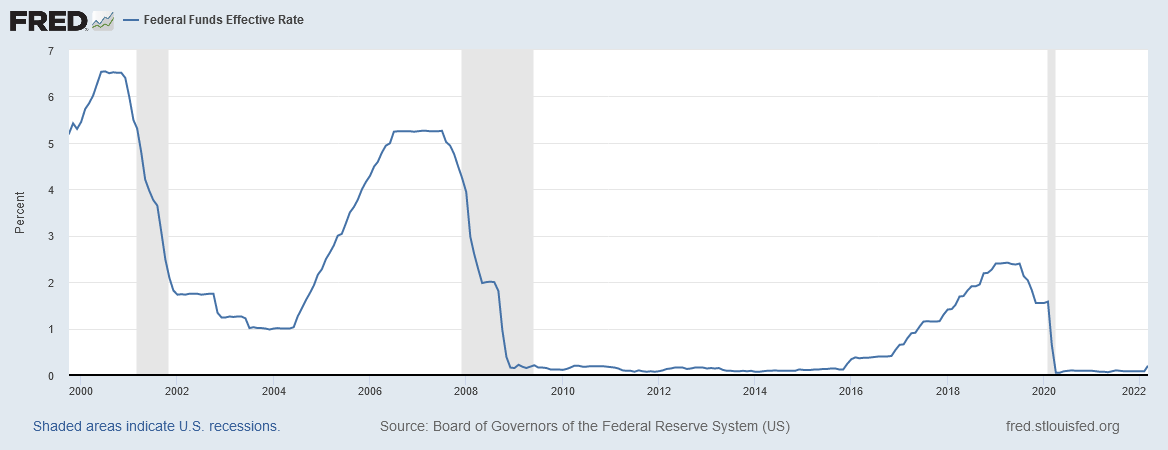
SCHD is considered a large cap value fund by Morningstar and this will be self-evident when I show my valuation calculations for the fund against the S&P 500 below. And of course, it’s a dividend growth fund, and thus in a higher rate environment, a bird in the hand is worth two in the bush. We can already see evidence of the rotation to value by examining the fund against the SPY and QQQ, zeroing the graph in December of 2021 when the Fed pivoted to a more hawkish stance:
SCHD vs SPY vs QQQ (Seeking Alpha)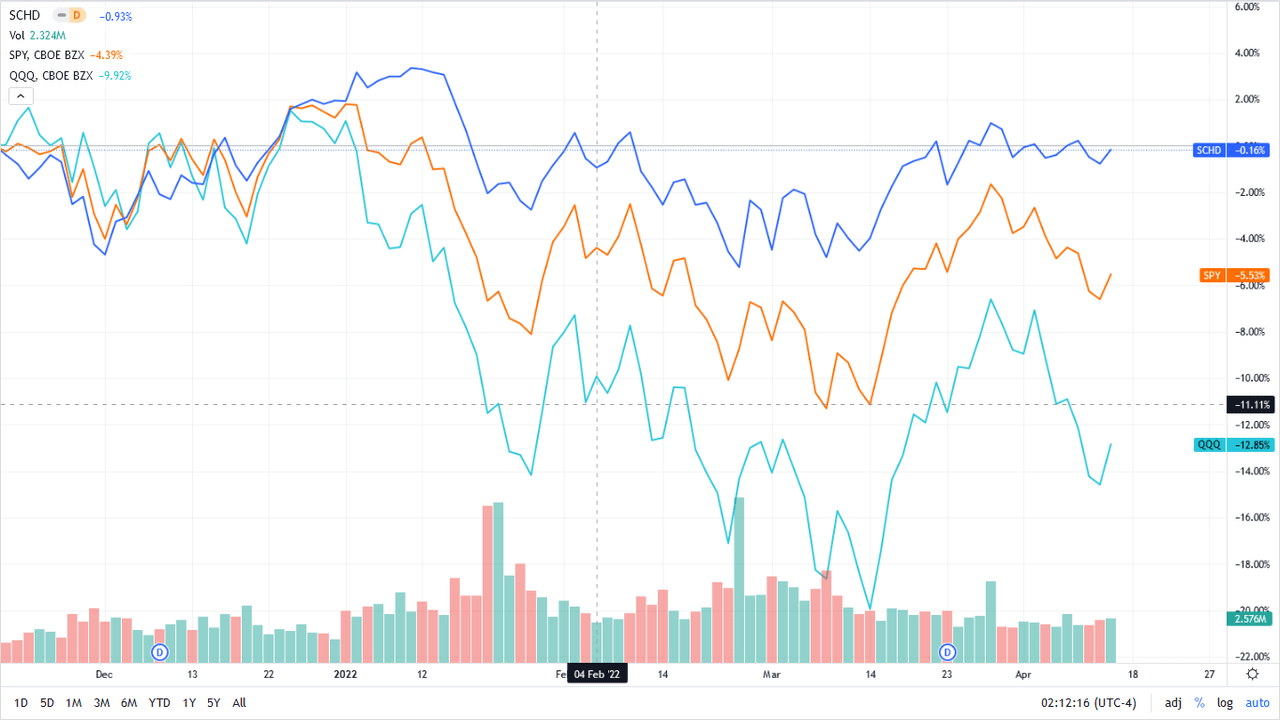
Financial Stocks’ Performance and Rate Hikes
SCHD currently has 49 financial holdings that represent 20.5% of its equity based capitalization (not including its small index fund derivatives and cash positions). Let’s briefly look at how financials tend to do under a higher Fed rate environment.
Davis Funds has provided information on financial related stocks’ sensitivity to interest rates:
As investors fret about the possibility of higher interest rates, many financial companies stand to benefit, as higher interest rates increase earnings. For insurance companies, higher interest rates benefit investment income, as float is invested in higher yielding bonds. For banks, higher rates increase the spread between deposits and loans. For example, based on the regulatory disclosure of our top bank holdings, a relatively modest increase of 50–100 basis points in interest rates would drive a 24% earnings increase in the first year alone.
Davis Funds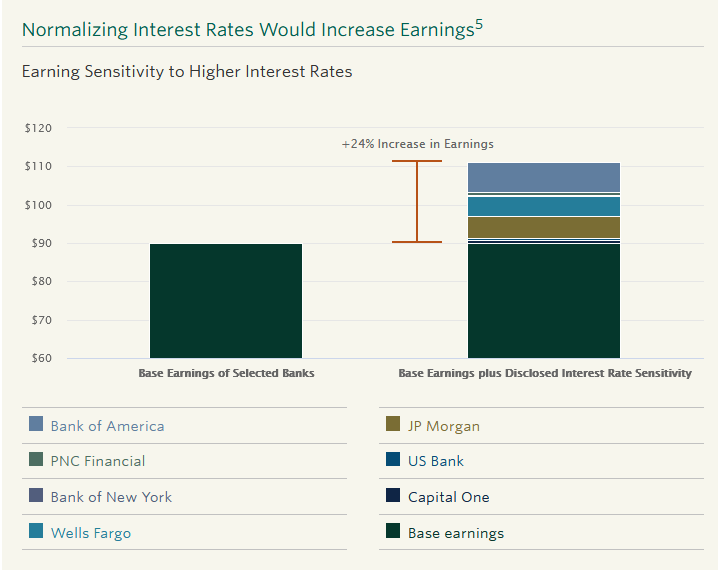
I wouldn’t expect a 24% earnings growth to be sustainable from an instinctive view point: Are the “too big to fails” really going to grow like they’re Silicon Valley tech companies in the long run? But I would expect SCHD to at least outperform, regarding their financial holdings, from this earnings tailwind.
Valuation
SCHD’s 10-year dividend yield average and 5-year average give us some quick insight into the current valuation of the fund. At the time of calculation the fund looks 5 to 8% overvalued based on the dividend yield.
|
Metric |
Yield |
Implied Fair Value |
Price to Fair Value |
|
10 year average yield |
3.03% |
$74.91 |
1.054 |
|
5 year average yield |
3.11% |
$72.99 |
1.082 |
|
12 month trailing yield |
2.87% |
Price at calculation = $78.97 |
Source: stockanalysis.com dividend history 4/6/22
I’ve further compared the equity capitalization of the fund against what it would be were each of its equity holdings to revert to their fair values overnight. For this calculation I’ve thrown out SCHD’s small cash position and a handful of futures derivatives tied to broad indexes that it had near the bottom third of its holdings by weight. I used Morningstar fair values when there was coverage, and when there wasn’t, I took the average of the fair value based on current forward earnings and the 5 year P/E average, and the fair value based on the dividend yield against its 5 year average, as published on Seeking Alpha.
|
Current Capitalization of Equities |
$34,604M |
|
Current Price |
$79.29 |
|
Capitalization if P/FV = 1 For All Equities |
$35,254M |
|
Implied Price at Fair Value |
$80.90 |
|
Price to Fair Value |
0.98 |
Source: Schwab, Seeking Alpha, Morningstar, proprietary equation 4/7/22
Now let’s compare that to the broader market. As of April 8, the S&P 500 is owning a forward PE of 19.3. That’s looking like around a 25% overvalued market based on the long term 15 or 16 mean PE (if you don’t believe J.P. Morgan, when it says the new normal may be 18).
Yardeni Stock Market Briefing 4/8/22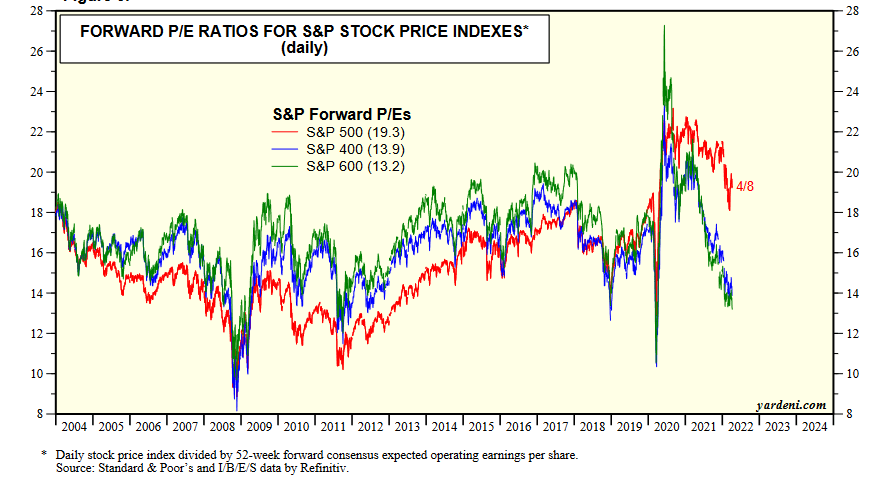
Because SCHD is in a better valuation position than the broader market, I would expect less of a drawdown relative to such, as the probable recession unfolds. But because the fund only came online in 2011, it’s a bit hard to back test this hypothesis. Not that we would get a good test for 2008, because, again, 20% of SCHD’s holdings are financials.
We do know what happened during the pandemic panic drawdown: it stayed coupled with the market, giving it a beta (volatility) rank of around 1 as shown by the JPM stress test below:
JPM Asset Management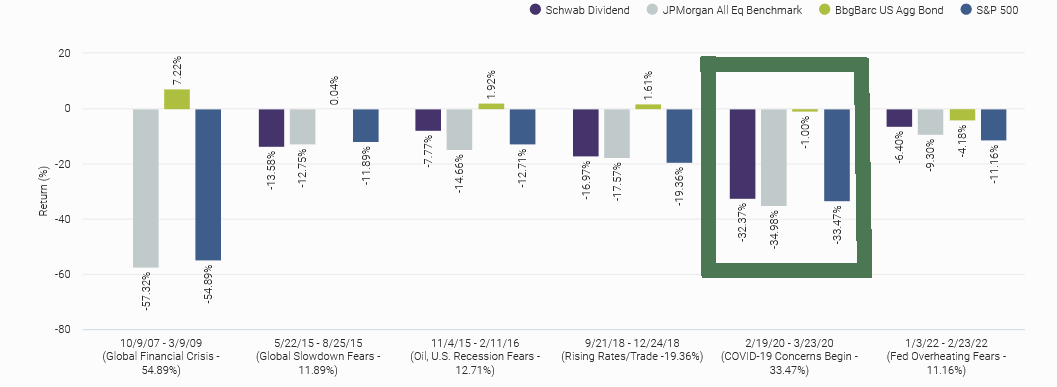
However, the problem with this stress test is that the pandemic drawdown happened so fast, it was based on sheer panic driven, ‘Everything is going to hell and I can’t tell what’s happening or how bad it will get,’ type selling, with traders navigating without the benefit of starlight in a storm. It was not pulled down based on forward earnings, and 3-5 year forward growth downward revisions that one might expect in a more classical bear market, playing out in slower motion.
In short, Chuck Carnevale aka Mr. Valuation’s catchphrase is “Valuation matters and it matters a lot,” – and he will likely be proven true once again here.
Let’s take another look at our financials with regard to valuations. Since 2008 financials have been trading at significantly lower PE’s than their pre-2008 histories or the S&P in general, with banks trading roughly at a 10 multiple, and the insurance sector somewhere in the 11 multiple range. The financial sector over the 2010’s was certainly the cheapest out of the eleven market sectors to buy into. And this is despite that the sector continues to vampire its way through the broader economy, and now generates up almost 30% of the S&P’s earnings.
Davis Funds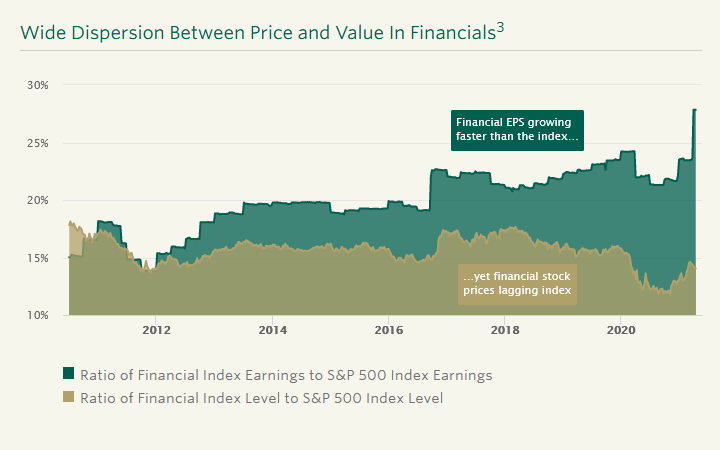
Were the 2008 trauma ever to dissipate and the financials to return to their pre-crisis PE’s, and likely they will on the multi-decade time horizon, then so much the better for SCHD; this unsprung coil just adds one more long term safety margin to the fund for long HODLers.
Growth Versus Value With Regard to Recessions
So what happens to value, i.e. SCHD, relative to growth, i.e. presently tech heavy S&P 500, during recessions? And how do commodity prices come into play here? J.P. Morgan Asset Management has it figured out on the chart below:
JPM Asset Management 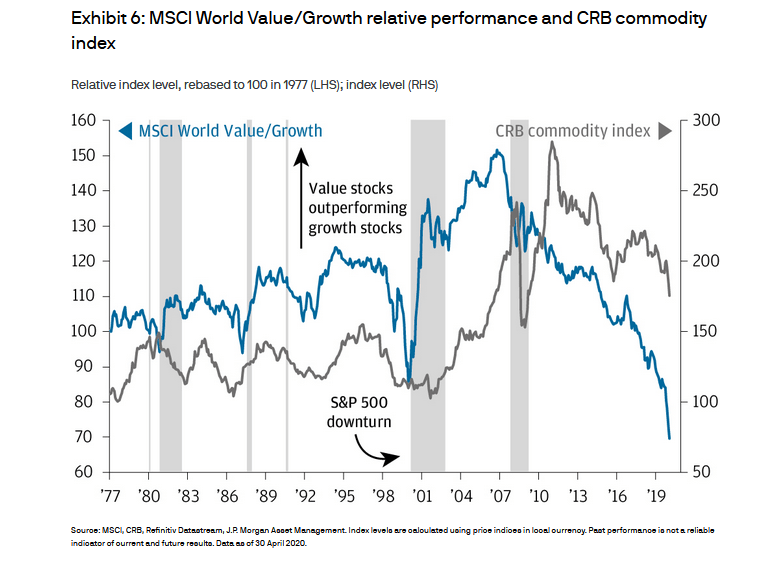
What we see is value outperforming growth during recessions. Further we see that value tends to do well when commodity prices are high or trending higher. And I think it’s fair to say higher commodity prices are starting to get baked into the first half of the 2020’s. The latest 5-year breakeven inflation print for April 8, 2022 is 3.33%.
St. Louis Fed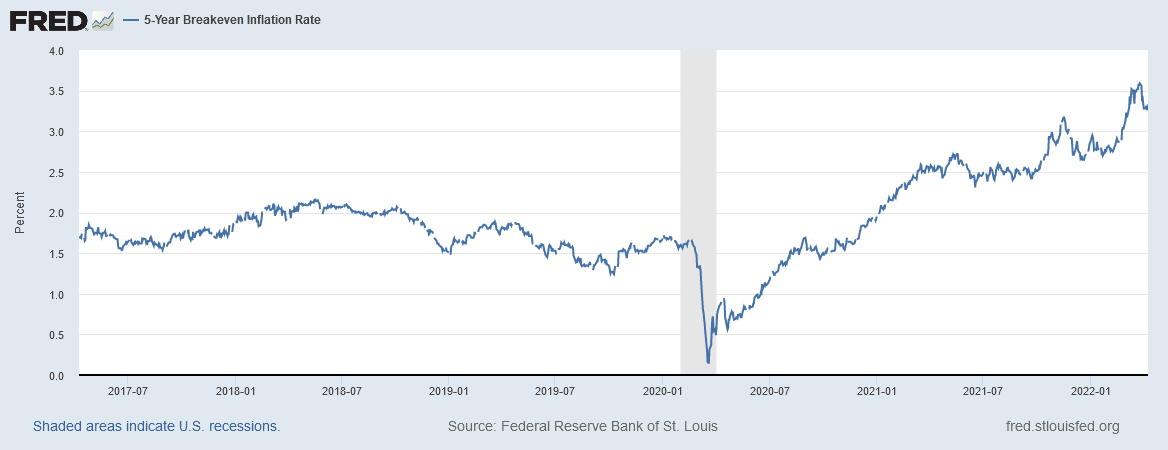
Further, value tends to outperform growth in recessions, and then tends to further hold up well, as a function of increased shorter term Treasury rates (synonymous with Fed rate hikes) after the storm has passed, or vice versa, since a large part of value is the financial stocks.
JPM Asset Management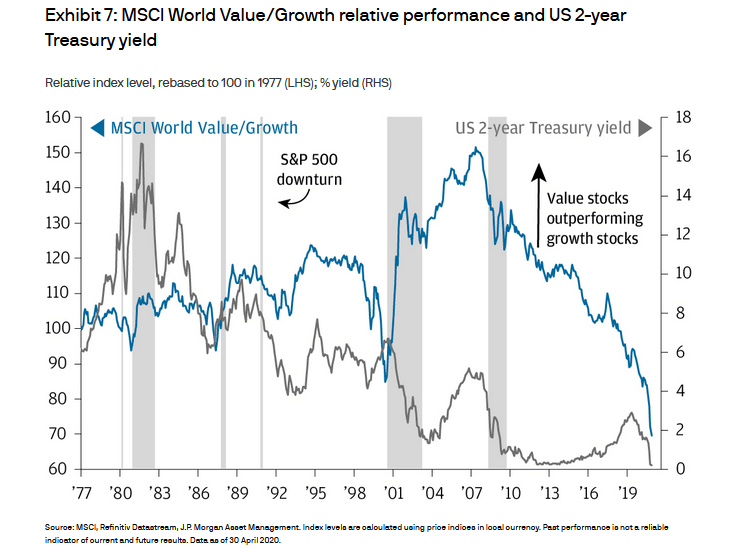
J.P. Morgan is using the 2 year Treasury on its graph as Fed has more control of shorter duration Treasuries:
Investopedia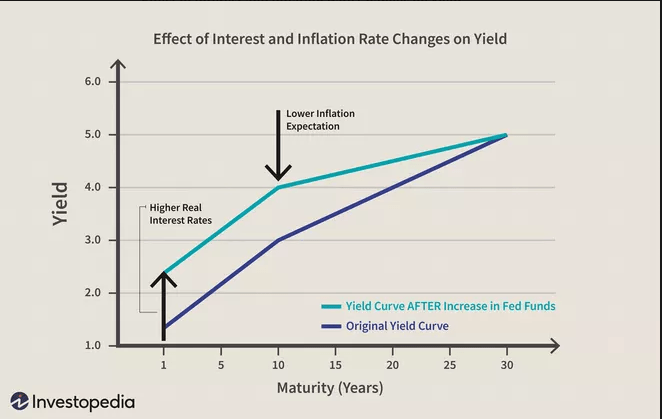
The Fed will be in a tight spot at the point it breaks the market, as likely there will still be refractory inflation playing out before the recession can consume it, and thus there will be some hesitation before it steps on the left side of the yield curve, or makes the money printer go burrrr, again; it’s like the Titanic with multiple captains, some with opposing mandate orders, steering too slow to avoid icebergs. If such occurs it will work to SCHD’s favor relative to the S&P 500. I think this is likely because the Fed has only pulled off two ‘soft landings’ (1984 and 1994) out of the last six times it’s tried to deal with inflation; and the present macro environment has been confounded and complicated due to the pandemic, making it that much more disastrous to navigate.
Safety
On the safety front, with regard to what to expect during a recession the fund already has a small but significant built in buffer: As of Friday April 9th’s close, 27.5% of the fund by equity weighting (just the equities I examined for value; not including the index derivatives and cash) was made of Dividend Aristocrats and Dividend Champions. These are the companies that have raised their dividends consistently for 25 years or more, i.e. they have a track record of raising their dividends through at least three recessions, including the financial crisis, and multiple smaller market drawdowns – a mark of high quality and safety. The Aristocrats and Champions in the fund are as follows: PEP, KO, IBM, ADP, MO, MMM, ITW, KMB, TROW, CINF, GPC, BEN, OZK, LEG, MGRC, MCY, and SRCE.
SCHD also has raised its dividend every year of its existence including during the latest pandemic years.
|
Time Period |
Dividend Growth CAGR |
|
2013 through end of 2021 |
16.5% |
|
2020 through end of 2021 |
10.8% |
I’ve further ran a weighted average GURU Financial Strength Score for the fund, using a modified version of my weighted average formula I originally developed to examine the value of ETF’s and mutual funds:
Proprietary Weighting Formula
P/FV in this case is replaced with the safety scores of each company in the fund, and of course the weighting is based on the capital weight of each holding in the fund. At present SCHD’s safety score is 5.48 out of 10. One can see where that stacks up against the market stalwarts below:
|
Company |
Guru Financial Strength |
|
Microsoft (MSFT) |
8 |
|
Amazon (AMZN) |
7 |
|
Johnson & Johnson (JNJ) |
7 |
|
Illinois Tool Works (ITW) |
6 |
|
SCHD |
5.48 |
|
Prudential (PRU) |
5 |
|
Pepsi (PEP) |
5 |
|
McDonald’s (MCD) |
4 |
|
Verizon (VZ) |
4 |
An example score is shown below to provide the nuts and bolts of what goes into it:
Guru Focus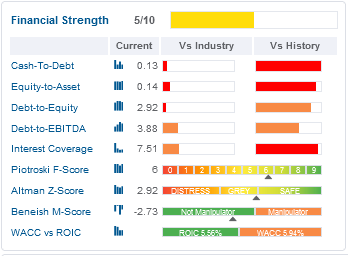
And finally I ran the same weighted average for all of the equity holdings in SCHD with regard to debt to EBITDA. Currently it’s sitting at 2.02, which is roughly equivalent to an S&P A credit rating. Again we’ll do a comparitory look below:
|
Debt/EBITDA |
S&P Equivalent Rating |
Long Term Bankruptcy Risk (%) |
|
1.1 or less |
AAA |
0.07 |
|
1.5 or less |
AA |
0.51 |
|
1.8 or less |
A+ |
0.6 |
|
SCHD = 2.02 |
A |
0.66 |
|
2.5 or less |
A |
0.66 |
|
3.0 or less |
BBB |
7.54 |
Source: Dividend Sensei on Seeking Alpha (original source S&P Global Ratings Research/S&P Global Market Intelligence’s CreditPro)
SCHD has about a 1 in 150 chance of being destroyed financially over the next 30 years based on its debt to EBITDA. Common sense tells us mutual funds and ETF’s actually don’t get destroyed, but I’m arguing that it is more likely to perform like a moderately high to high quality stock in a recession or sustained rate hike series, than like an overburdened one.
Conclusion
Traders are currently rational actors with regard to capital flows into the SCHD. It will be a safe harbor dividend ETF for the coming macro storms ahead. This one is a solid hold, but I will consider personally adding to my position if these headwinds push it down into 4% yield territory.
[ad_2]
Source links Google News

