[ad_1]

syahrir maulana
Introduction to RWJ
Invesco S&P SmallCap 600 Revenue ETF (NYSEARCA:RWJ) is an exchange-traded fund that provides investors with exposure to small-cap U.S. stocks. The fund’s portfolio is constructed so as to place a heavier bias on higher-revenue companies (stocks are included on a revenue-weighted basis).
Background Information
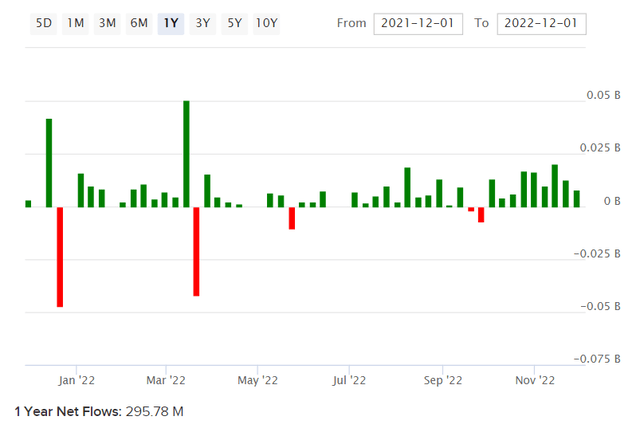
RWJ carries an expense ratio of 0.39% according to Invesco themselves, with net assets under management of almost exactly $1 billion as of recent. That follows positive net fund flows over the past year of around $296 million, as illustrated below.
ETFDB.com
This would suggest the fund is not only moderately popular, but has gained in popularity, especially recently.
Financial Information
RWJ’s portfolio is based on the fund’s benchmark index, which it seeks to track. That is, the S&P SmallCap 600 Revenue-Weighted Index. Unfortunately the most recent factsheet for the fund does not provide any financial ratios. However, Morningstar offer a forward price/earnings ratio of 9.53x as of December 4, 2022, and a price/book ratio of 1.27x. That implies a forward return on equity of 13.33%.
Meanwhile, the Wall Street Journal presents an average portfolio price/earnings ratio of 12.97x (trailing) and an average price/book ratio of 1.88x. A third data source, ETF.com (whose data provider is FactSet), provides us with a price/earnings ratio of 10.22x, and a price/book ratio of 1.50x. Clearly, different methodologies and timing issues have created conflicts. However, we can probably assume that the forward price/earnings ratio is approximately 10x based on current earnings estimates, and that the trailing price/book ratio is in the region of 1.3-1.8x.
Morningstar also estimates that three- to five-year average earnings growth to equate to circa 8.15% for RWJ’s portfolio.
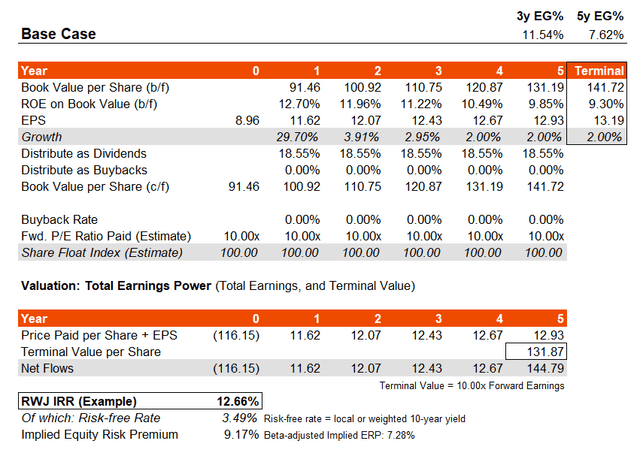
Having said this, Invesco offer trailing and forward price/earnings ratios of 8.34x and 8.10x, respectively. That suggests both higher near-term earnings, and lower near-term earnings growth. To be conservative, I will assume a forward price/earnings ratio of 10x, and use WSJ’s trailing ratio such that my earnings growth rate in year one will be positive. I am also going to assume that forward returns on equity gradually drop toward 9% over six years. This feels intuitively conservative, but takes my average earnings growth rate down to 7.62% over five years, which is close to the Morningstar headline estimate.
Basic IRR Model
Using the above information, I have generated the model below which keeps most factors constant, including the forward price/earnings multiple which will drive the terminal-year valuation as well. The implied IRR is 12.7%.
Author’s Calculations
Changing certain inputs like the price/book ratio assumption does not materially affect the IRR outcome. Based on this earnings growth trajectory, it would seem as though RWJ is undervalued. The historical beta of the fund is elevated at about 1.26x, but even after we adjust for this, the underlying equity risk premium seems high, which would suggest under-valuation. That is also assuming that the forward price/earnings ratio remains as low as 10x, which seems unlikely in the long run, and therefore it is possible that RWJ will benefit from long-term earnings multiple expansion too (which would further enhance the IRR).
Relative Investment Performance of RWJ
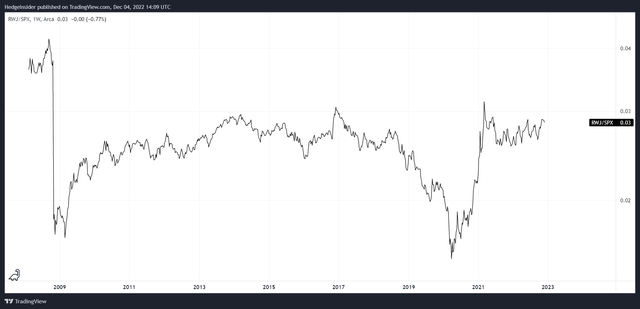
RWJ was launched in February 2008. Since then, on a price-only basis, the fund has under-performed (see the ratio below which compares the price of RWJ shares with the S&P 500 U.S. equity index level, expressed as a ratio).
TradingView.com
However, much of the under-performance began right around the 2007/08 crisis, when small-caps sold off. Since then, you can see the fund has mostly traded within a range, currently at the top of its long-term trading range. One could argue that the beginning of a new business cycle, which is possible in the medium term, could engender a multi-year period of modest out-performance. That is especially conceivable given the high potential underlying IRR per my assumptions, and the low forward earnings multiple.
RWJ’s Key Sector Exposures
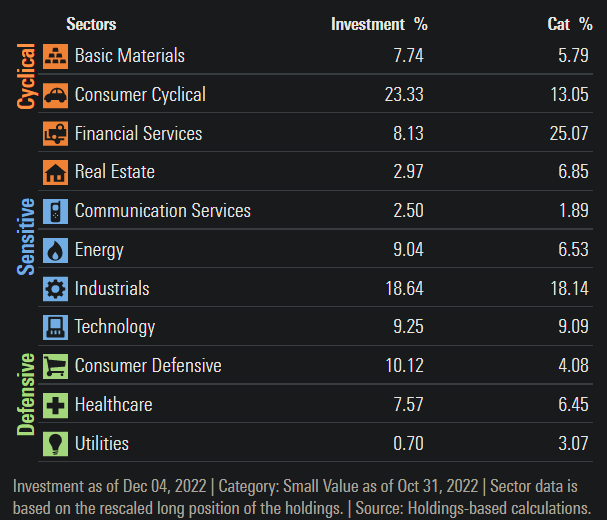
Key sector exposures of the fund seem to emphasize cyclical and economically sensitive stocks, which makes sense as companies operating more defensive sectors tend to be more mature and larger. Small-cap stocks that RWJ invests in are disproportionately represented by cyclical and sensitive sectors like “consumer cyclical” (i.e., consumer discretionary), and industrials.
Morningstar.com
Again, these could help buoy the fund and generate positive/upside beta into a new business cycle. Current business cycle positioning as of Q4 2022, as depicted below, suggests the United States is heading into a recessionary period. Nevertheless, markets can lead the economy by circa 12 months, and the average recession is less than 12 months long. It is possible that the market is in a bottoming process at the moment, and that funds like RWJ could benefit from so-called “upside beta” into an economic/market cycle phase.
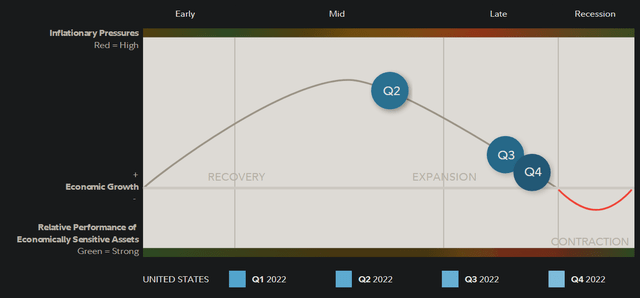
Fidelity.com
It is indeed difficult to time both the economy and markets. However, one can take some comfort in RWJ’s apparently modest valuation, even if timing upon entry is imperfect.
Summary
In conclusion, I think RWJ is undervalued, and probably well positioned in the medium term, with a higher probability of being well positioned over the longer term (several years). A potential IRR of over 10% per annum over the next five years is definitely conceivable based on present prices and a straightforward assessment of RWJ’s underlying earnings power (using multiple data sources).
The fund is also relatively well diversified, with 593 holdings as of December 1, 2022 (all but one of which represent less than 3% of the fund overall).
[ad_2]
Source links Google News

