[ad_1]
The Direxion Daily Small Cap Bull 3x Shares ETF (TNA) experienced a brief rally after being down more than three days in a row and touching critical support of the 100-day moving average.
But, it failed to make its run-up back to the 200-day moving average, unlike the S&P 500 3x Shares ETF (NYSEARCA:UPRO) and only ended up making it back to the short term, 20-day moving average.
In other words, not only did TNA fail to stage a rally back up to the critical, longer-term 200-day moving average, but it didn’t even reach the 150-day moving average. This move is bearish, in some ways, because it indicates weak momentum.
Even though technicals are not the only factor that matter for equities, as fundamentals play an equally, if not more important role, technicals tend to decide the short-term direction of equities. Consequently, it is important to reassess where TNA is on its chart before deciding whether to buy or sell.
By all signals given thus far, despite having had nearly a 100% run-up from its lows, it appears that TNA is still holding major support after the recent fail of the 20-day moving average and can, therefore, continue its uptrend higher. As a result, I remain long shares but am hedging my bets by selling calls, which we will discuss further below.
Fund Details
TNA is a vehicle that allows people to play the Russell 2000 with triple leverage, which can significantly benefit investors during bull markets and severely punish them during bear markets.
To be more clear:
The investment seeks daily investment results, before fees and expenses, of 300% of the daily performance of the Russell 2000-® Index. The fund invests at least 80% of its net assets (plus borrowing for investment purposes) in securities of the index, exchange-traded funds (“ETFs”) that track the index and other financial instruments that provide daily leveraged exposure to the index or ETFs that track the index. The index measures the performance of approximately 2,000 small-capitalization companies in the Russell 3000-® Index, based on a combination of their market capitalization and current index membership. The fund is non-diversified.
Expense ratios are typically higher for leveraged funds, but an expense ratio of 1.10% for TNA is not much to sacrifice considering the triple-digit returns it can provide.
It should also be noted that TNA leverages the Russell 2000 (IWM) parent index. Therefore, when IWM was up around 30% from its 2018 lows, TNA, equivalently, was up about 90% from its lows (before its recent pullback in March of 2019). This is typically how the 3x leverage aspect of the fund works.
Sector Exposure
Even though TNA is a triple-leveraged vehicle, it is obviously more diversified than traditional ETFs since the fund holds 2,000 names across multiple sectors. This diversification offsets the added risks that leveraged funds tend to come with.
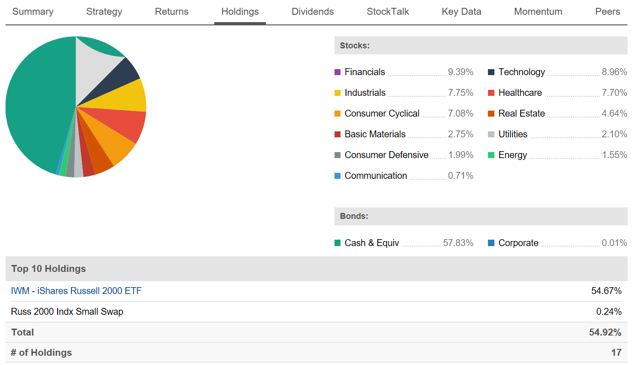
Source: Seeking Alpha
In addition to the leverage and diversification that TNA offers, it also has more growth-oriented holdings than traditional funds like the SPDR S&P 500 Trust ETF (SPY). This element of higher beta names owned by the fund makes it the preferred vehicle of certain growth investors.
Russell 2000 Holdings
Here are TNA’s top holdings below:
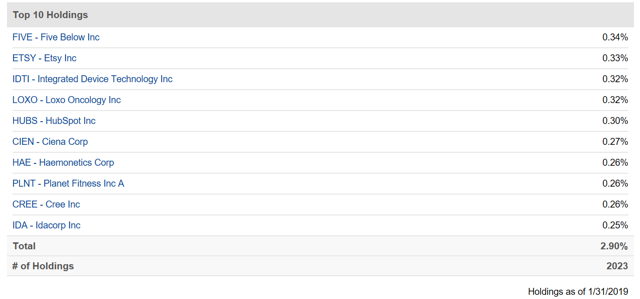
Source: Seeking Alpha
Companies like Planet Fitness, Inc. (PLNT) and Five Below (FIVE), for example, are some of the top holdings that can be found in the Russell 2000. If, for whatever reason, one of these companies were to struggle, the diversification of the fund should help sustain its overall outperformance vs. smaller growth funds.
Technicals On The Fence
Investors may already be aware of the bullish fundamentals that the U.S. economy is displaying, such as low interest rates that make loans more attractive to small business owners, low inflation, low gas prices, and improving trade relations between the U.S and China, to name a few.
Of course, there is always the worry of rising interest rates from the Fed as it unwinds its balance sheet as well as trade relations deteriorating with China. However, these negative factors are necessary to climb the wall of worry.
Fundamentals are one half of the story, and technicals tend to usually be the other half. So, let’s get right into it and breakdown TNA’s chart in order to better ascertain where the fund is headed.
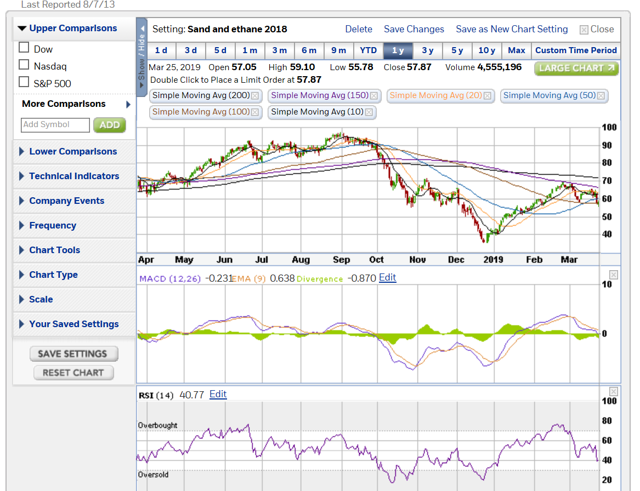
As investors can see below, the 100-day moving average has become the line in the sand for TNA, as it is now depending on the key area of support to maintain its uptrend.
Source: E*TRADE
Investors can also see that if current levels of around $60 per share fail or the 100-day moving average area (brown line), then support won’t come into play for quite some time, until the $50 level, in fact. This is where structural support lies, as $50 was formerly a brief consolidation point in 2018 and a breakout point in 2019.
Thankfully, TNA’s RSI is already at 40, so any drop to $50 per share would result in the RSI being completely oversold, which is where rallies ensue.
In similar fashion, the IWM is on its 100-day moving average as well (brown line). Although it is not unusual for both funds to mimic each other (as that’s the goal of TNA), it is unusual that both, TNA and IWM, are displaying the same support levels. 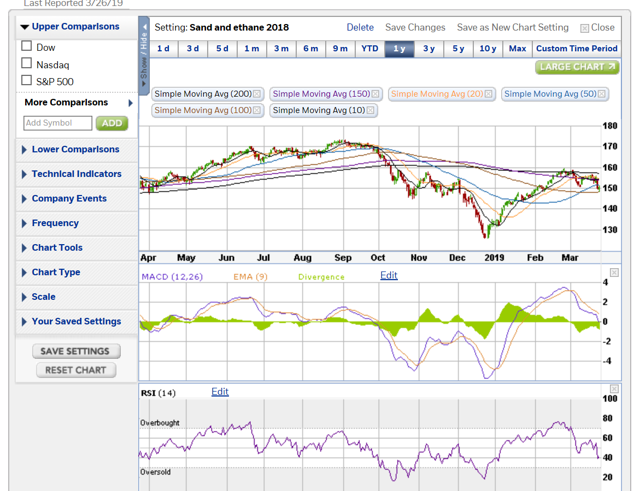
Source: E*TRADE
This coincidence means nothing in terms of stars aligning. But, it does give investors added reassurance that TNA is mimicking IWM, which is a fear that many investors have when using leveraged ETF strategies.
Risks
When the VIX is high, it is time to buy. When the VIX is low, it is time to go. This is the old adage that Wall Street uses when referencing the VIX, which measures put buying and fear levels.
Source: E*TRADE
Therefore, when the VIX is high, it is time to buy because heavy fear exists in the marketplace, where equities are usually at more reasonable valuation levels.
So, with the VIX being high, some risk should automatically be removed from the marketplace. However, fear levels could always spike higher, causing equities to sell off further.
Another risk worth pointing out is one that I alluded to above, which is that leverage investing through ETFs can result in compounding losses from sideways volatility and cause the leveraged ETF to not correspond accurately with the movements of the parent index.
Therefore, a rebalancing strategy should be maintained regularly (although this is usually only needed for commodity-linked ETFs).
Conclusion
The Russell has failed its breakout after touching critical support and being down for more than three days in a row. However, the fund is not completely down and out, as shares are still on critical support of the 100-day moving average.
I expect this level to hold. Otherwise, the uptrend will be broken, leading to a possible continuation of the bear market started in 2018, which I don’t think the market is justified in having, especially when fundamentals remain strong for small businesses.
Therefore, I am bullish on TNA and small businesses but I am hedging my bets by selling calls, which are fetching nice premiums after the historic rally that followed the 2018 crash.
This way, if my calls expire (mid-April) out of the money as the market goes lower, the extra premium gained partially offsets the losses in the underlying.
At the same time, if the market goes higher, I only risk getting called away from a small portion of my shares and still made a nice premium to exit part of the position. Admittedly, I would like to pocket the premium without getting called away at expiration, just in time before the next leg higher begins.
As a result, I remain long TNA but only assuming current support of the 100-day moving average holds and the uptrend remains intact.
Disclosure: I am/we are long TNA. I wrote this article myself, and it expresses my own opinions. I am not receiving compensation for it (other than from Seeking Alpha). I have no business relationship with any company whose stock is mentioned in this article.
[ad_2]
Source link Google News
