[ad_1]
Stephen Chernin/Getty Images News
(This article was co-produced with Hoya Capital Real Estate)
Introduction
With $182b in assets, the Invesco QQQ ETF (QQQ) ranks as the 5th largest ETF traded in the United States and by far the largest NSADAQ ETF. Its popularity can be seen by having over 250k Seeking Alpha followers and three articles in the first half of April alone. If you watched “March Madness”, then you saw their commercials and that QQQ is the official ETF of the tournament!
My prior two articles covered and compared using different Covered Call strategies and compared those funds against QQQ’s performance:
- QQQX Vs. QYLD: 2 Covered Call Funds On The NASDAQ 100
- QYLG Vs. QQQX: Readers Say A Better NASDAQ 100 Comparison
Based on the interest showed for those articles, this one examines whether either ETF that invests using the NASDAQ-100 Equal Weighted Index can be a better choice as measured by return, yield, or risk-reduction than investing in QQQ. The results are mixed but QQQ is far better in the one most investors focus on. Statistics say NYSEARCA:QQQE is better at equal-weighting than NASDAQ:QQEW.
Defining the NASDAQ-100 Equal Weighted Index
Both ETFs invest based on the same Index, which NASDAQ describes as:
The NASDAQ-100 Equal Weighted Index is the equal weighted version of the NASDAQ-100 Index which includes 100 of the largest non-financial securities listed on The NASDAQ Stock Market based on market capitalization. The Index contains the same securities as the NASDAQ-100 Index, but each of the securities is initially set at a weight of 1.00% of the Index which is rebalanced quarterly.
Source: indexes.nasdaqomx.com NDXE
The Index Methodology was adjusted in June of 2021 and those adjustments were explained in a PDF. At a glance, it appears they are related to how corporate actions will be handled.
Direxion NASDAQ-100 Equal Weighted Index Shares Review
Seeking Alpha describes this ETF as:
The investment seeks investment results before fees and expenses that track the NASDAQ-100® Equal Weighted Index. The fund, under normal circumstances, invests at least 80% of its assets in the securities that comprise the index or investments with economic characteristics similar to the securities included in the index. The index is the equal weighted version of the NASDAQ-100 Index® which includes approximately 100 of the largest domestic and international non-financial companies listed on the NASDAQ® Stock Market based on market capitalization. The fund is non-diversified. Benchmark: NASDAQ-100 Equal Weighted TR USD. QQQE started in 2012.
Source: seekingalpha.com/symbol QQQE
QQQE has $638m in assets and costs investors 35bps in fees. While the TTM Yield shows at 4.4%, that was due to a large $2.87 Long/Short-term gain distribution. The average yield, without that payment, has been near .7% over the last few years.
Direxion describes their ETF as:
QQQE provides equal-weight exposure to all NASDAQ-100® Index holdings, allowing you an opportunity to manage risk in your portfolio through:
- Broader diversification beyond technology sector stocks which may help reduce concentration risk
- Greater performance contribution from companies with smaller market capitalization
- Quarterly rebalancing for consistent equal-weighting, after regular market fluctuations
Source: direxion.com QQQE
QQQE Holdings review
Since each stock starts out at 1% of the equity weight and rebalancing was at the end of March, it shows the sectors and holdings at that time. It compares QQQE against the index used by QQQ. This gives investors a clear picture of how the two ETFs allocate their equity holdings. XNDX is market-cap weights; NETR equal-weighted.
direxion.com QQQE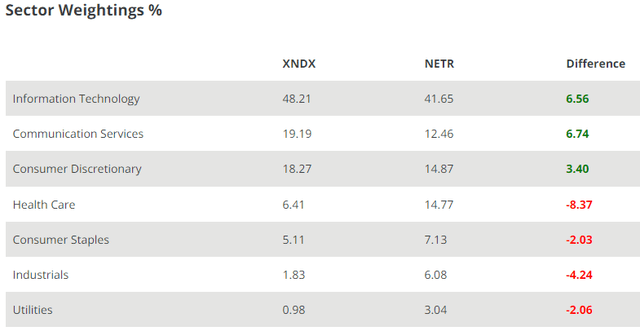
The ranking is based on XNDX weights. At first glance, when seeing the next two holdings charts, how the NETR Tech weight is that close.
direxion.com QQQE direxion.com QQQE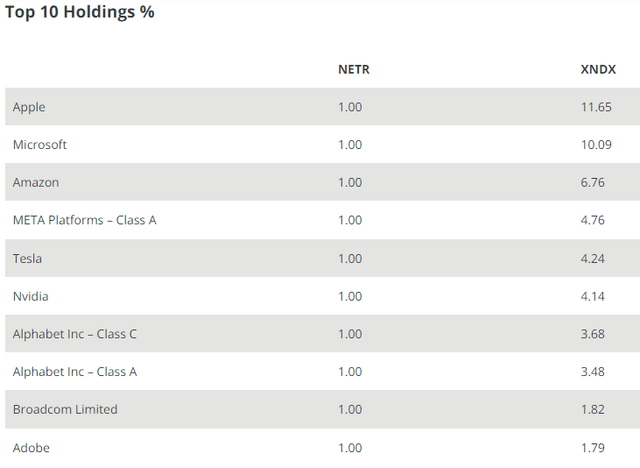
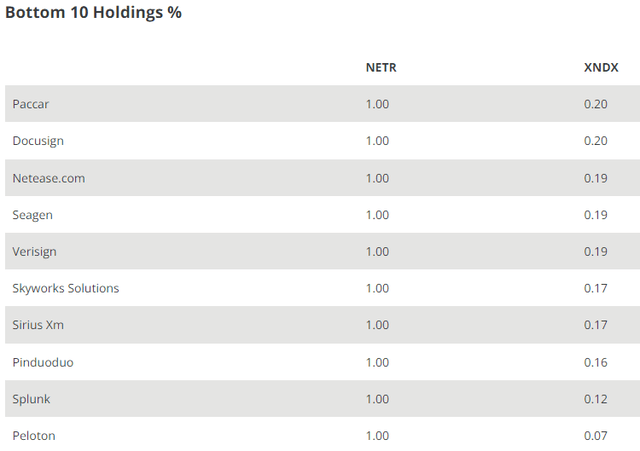
When I checked, The NASADAQ 100 itself had 89 stocks with a weight below 1%. That means the 11 stocks over 1% spread that excess weight over the other 89 stocks so all are at 1%.
Today’s Top/Bottom holdings
These represent the holding weights as of 4/20/22.
direxion.com QQQE Holdings; compiled by Author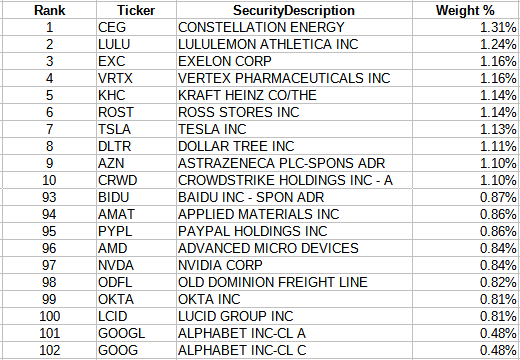
These are the Top and Bottom 10 stocks held by QQQE. Three weeks past the rebalancing, 42 stocks are up, 4 held steady, and 56 are down, relatively speaking.
QQQE Distribution review
seekingalpha.com QQQE DVDs
Direxion shows a small $.034 capital-gains distribution in 2020 too. Since both ETFs follow the same Index and both rebalance quarterly, I tried find a news story to explain why QQQE had such a large LT/ST CG distribution whereas QQEW did not: I failed to find any. It probably means QQEW is sitting on their gains.
First Trust NASDAQ-100 Equal Weight Index ETF review
Seeking Alpha describes this ETF as:
The investment seeks investment results that correspond generally to the price and yield (before the fund’s fees and expenses) of an equity index called the NASDAQ-100 Equal Weighted IndexSM. The fund will normally invest at least 90% of its net assets (including investment borrowings) in the common stocks and depositary receipts that comprise the index. The index is the equal-weighted version of the NASDAQ-100 Index® which includes 100 of the largest U.S. and international non-financial companies listed on Nasdaq based on market capitalization. Benchmark: NASDAQ-100 Equal Weighted TR USD. QQEW started in 2006.
Source: seekingalpha.com QQEW
QQEW has $1.2b in assets and has a current yield of .7%. First Trust charges a higher fee of 58bps.
QQEW Holdings review
QQQEW presented their data in a manner that allowed me to calculate Sector allocations.
ftportfolios.com QQEW Sectors; compiled by Author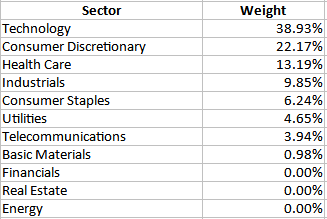
No Financial allocation is due to NASDAQ 100 excluding those stocks; the other two have none in the size range; especially Energy as those large stocks trade mostly on the NYSE.
Today’s Top/Bottom holdings
These represent the holding weights as of 4/20/22.
ftportfolios.com QQEW Holdings; compiled by Author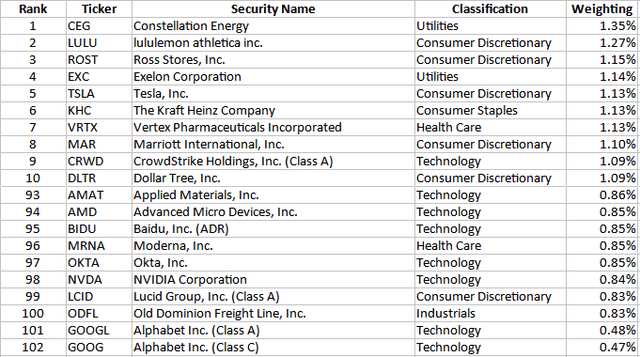
Notice that despite following the same strategy, the weights and ordering differ between the two ETFs. This indicates that the required quarterly rebalancing was not executed the same and that would be expected; though the execution prices should be close.
QQEW Distribution review
seekingalpha.com QQEW DVDs
Dividends show no clear pattern of growth. The pattern seems to indicate some stocks have a semi-annual payout policy. QQEW’s recent tax documents show 100% of the payouts have been classified as Ordinary Income.
Comparing Equal-Weight ETFs
With the major difference between QQQE and QQEW being that QQQE charges 23bps less in fees, execution of the balancing trades has resulted in slight differences in key ratios.
jhinvestments.com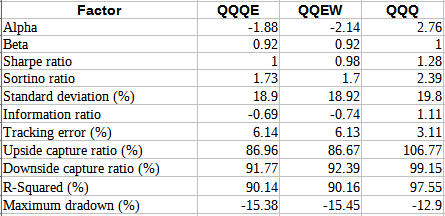
Almost across the board, the factors favor QQQE over QQEW, and in some cases, QQQ too. QQQE had a 30% turnover ratio last year versus only 23% for QQEW. That might be one reason QQQE had a capital-gains distribution.
PortfolioVisualizer.com; compiled by Author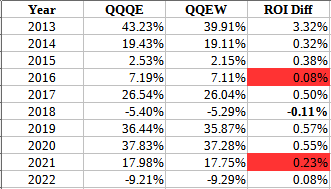
I assume 2013 was affected by QQQE starting in late 2012. Except for 2018, QQQE was the better performer in executing the same strategy. In two years (marked in red), the difference was less than the fee difference charged by the ETFs.
This is how that translates into what investors saw.
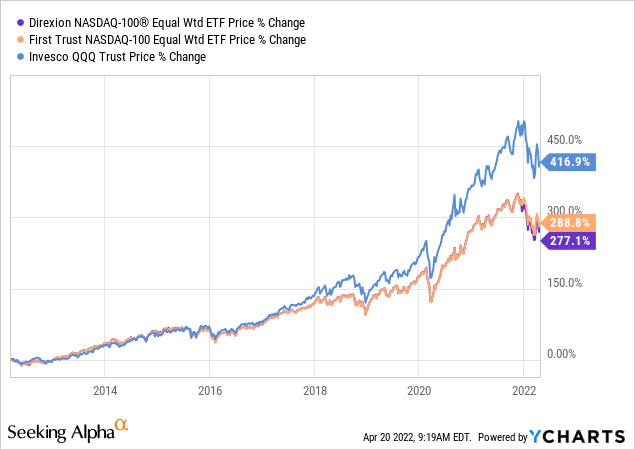
The price movements for QQQE and QQEW are so close, you only see separation starting late in 2021. QQQ started leaving both behind by 2016.
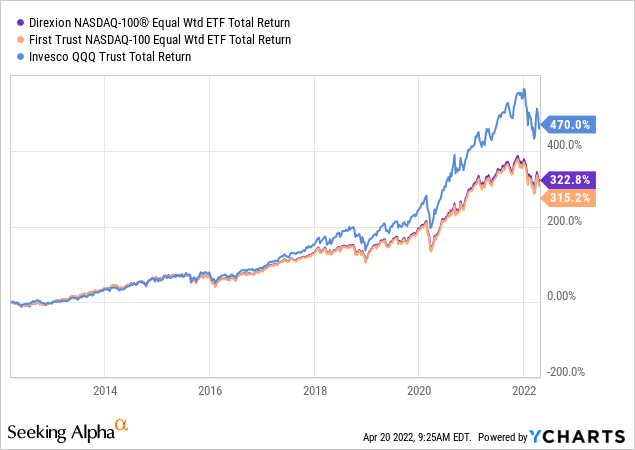
Looking at Total Return, QQQE moves ahead of QQEW. What might come as a surprise is both equal-weight ETFs trail QQQ by a larger margin on a Total Return basis despite slightly higher yields.
Portfolio Strategy
From my review, the easy part of the strategy analysis is declaring the Direxion NASDAQ-100 Equal Weighted Index Shares ETF as the superior choice between the two equal-weighted ETFs, despite recent results. What I leave investors to decide, based on their investment goals, is how to “play” the Nasdaq 100 stocks, if at all. Here is a sample of some of the popular funds that focus on these 100 stocks in some fashion.
Hoya Capital Income Builder Marketplace
The fact that four funds haven’t reached their third anniversary shows the growing interest in these stocks. When you look at what this small set of stocks have done since 2016, for investors willing to take on the extra risk QQQ has had versus Large-Cap and the total US market, the CAGR seems very attractive.
portfoliovisualizer.com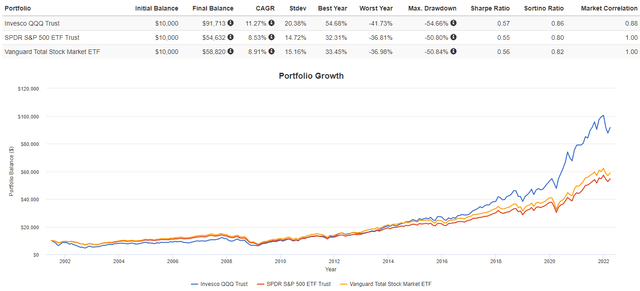
Final Thought
As I was completing this article, Netflix (NFLX) reported their subscriber count dropped 200k, first decline in over a decade. Worse yet, they are projecting a 2mm lost this quarter. Combined, that is <1% of their subscriber base. What did investors do? NFLX dropped 35%!. That, and related fears about streaming companies, sent QQQ down 1.46%; whereas QQQE only fell .86%, with QQEW down 1.05%. This is a reminder that regardless of the strategy chosen, the results driver in all cases is the performance of the stocks themselves.
[ad_2]
Source links Google News

