[ad_1]

-Antonio-
Investment Thesis
ProShares touts that its S&P Midcap 400 Dividend Aristocrats ETF (BATS:REGL) is the only ETF focusing on mid-cap U.S. companies that have grown their dividends for at least fifteen consecutive years. Among 60 mid-cap ETFs with five-year betas ranging from 0.96 to 1.48, REGL sits alone at 0.84 and has outperformed all its competitors since its February 2015 launch. These are excellent reasons to buy. However, the purpose of this article is to challenge readers for even considering the mid-cap category in the first place. As good as REGL’s fundamentals are, you can maintain the low-beta feature and improve your portfolio’s dividend yield, growth, diversification, and overall profitability with a simple two-ETF solution. That’s my preferred path, and I look forward to explaining this alternative in more detail below.
REGL Strategy and Performance
As mentioned, REGL selects U.S. mid-cap companies that have grown dividends for at least 15 consecutive years and weights them equally. Currently, 47 companies qualify, with very few additions and deletions each year. That’s beneficial to passive investors because they know what they own and won’t have to keep up with the high turnover common to rules-based strategies. All that’s required are regular assessments of the portfolio’s fundamentals and a “big picture” view of how the ETF has performed against its peers. That’s what I aim to provide today.
ProShares provides historical performance metrics for REGL on its website, allowing investors to quickly see the impact of its relatively high 0.40% expense ratio. Through August 2022, its Index gained an annualized 10.30% since its February 3, 2015, inception date, compared to 9.89% for the ETF.

ProShares
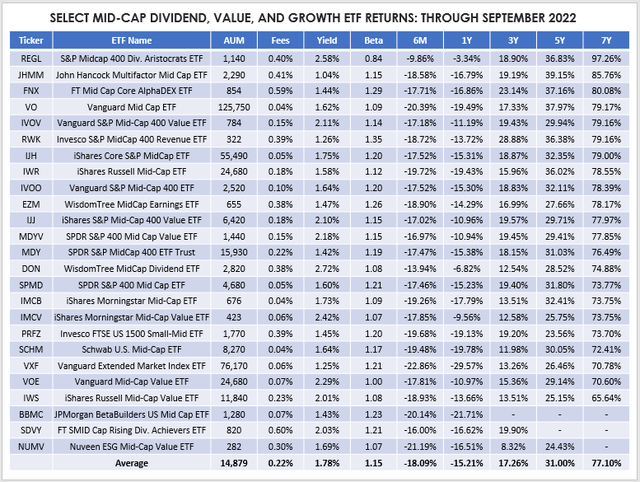
ProShares ETFs aren’t cheap. Except for its S&P 500 Ex-Sector ETFs (SPXE, SPXN, SPXT, SPXV), its funds charge between 0.35% and 0.67%. I think these high fees should cause concern for dividend investors, especially given how much these fees impact net distributions. However, it’s hard to argue with REGL’s performance. Over the last seven years through September 2022, REGL gained 97.26%, trouncing its competition, which includes the Vanguard Mid Cap ETF (VO).
The Sunday Investor
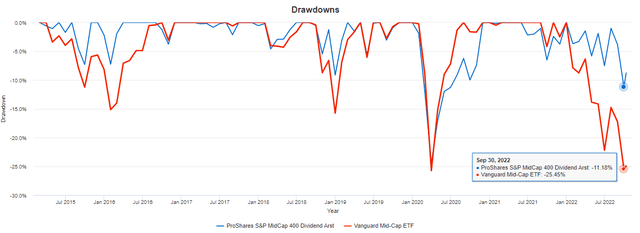
Capital preservation was vital, as REGL lost only 3.34% over the last year compared to 19.49% for VO. The following chart highlights how REGL’s drawdowns are often much lower than VO’s. The lone exception was in Q1 2020 when pandemic growth stocks generally outperformed. However, REGL has since held up reasonably well.
Portfolio Visualizer
These charts present a strong bull case for REGL as a long-term mid-cap investment. I won’t attempt to downplay these positive results; instead, I want to challenge readers for considering mid-cap dividend and value ETFs in the first place. To illustrate, consider that:
- 16 other dividend ETFs have a lower five-year beta than REGL
- Nine have outperformed over the last seven years
- 22 have outperformed in the previous five years
- Eight have outperformed over the previous year
- 50 have higher expected dividend yields
With metrics like these, it’s worth looking elsewhere, but first, let’s take a closer look at REGL’s composition.
REGL Analysis
Sector Exposures and Top Ten Holdings
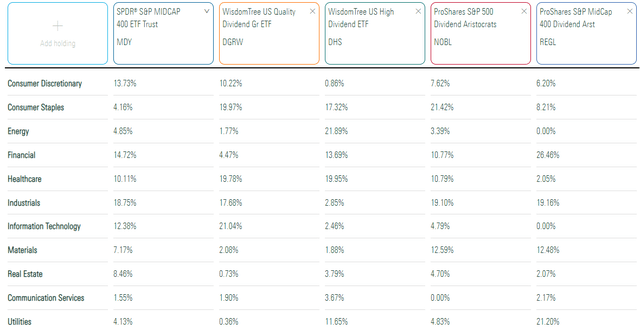
REGL’s advantage this year is zero exposure to the Technology sector. It’s also benefitted from a 21.20% exposure to Utilities, which are excellent investments in bear markets. Materials are also prominent at 12.48%, but REGL has no Energy exposure. Therefore, it’s a bit unbalanced, and mid-cap investors might want to consider pairing it alongside an ETF like MDY for better diversification.
Morningstar
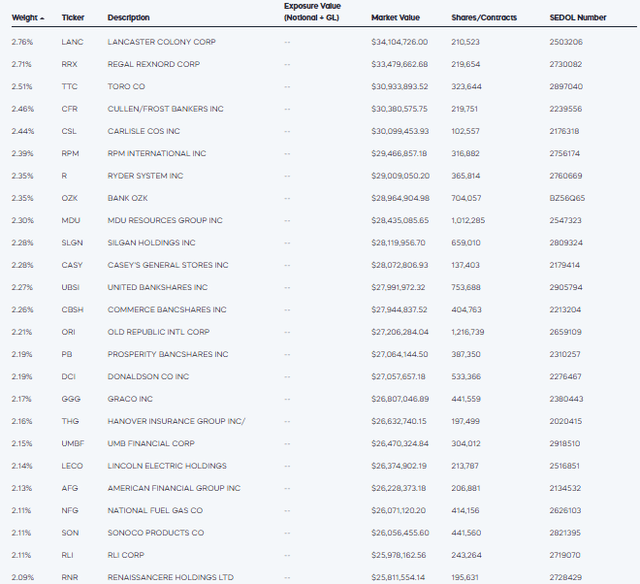
Another option is pairing REGL with the ProShares S&P 500 Dividend Aristocrats ETF (NOBL) to gain more Consumer Discretionary and Financials sector exposure at the expense of Utilities. That’s not my recommended approach, as I think NOBL’s fundamentals are lacking. Instead, combining DGRW and DHS would give you at least 5% exposure to most sectors and result in a similar 0.85 five-year beta. I’ll consider this paring alongside REGL’s fundamentals shortly, but let’s look at REGL’s top 25 holdings next, which total 57.24% of the ETF.
ProShares
Regional Banks like Cullen/Frost Bankers (CFR), Bank OZK (OZK), and four others are prominent holdings, totaling 13.71% of the ETF. REGL also holds six Gas Utilities, including National Fuel Gas (NFG) and New Jersey Resources (NJR), totaling 11.70%. However, the top holding is Lancaster Colony (LANC), the least-volatile company in the Index relative to the market. LANC has a 0.11 five-year beta and is one of the few constituents trading somewhat to its 52-week high price.
Company Fundamental Analysis vs. DGRW/DHS Pairing
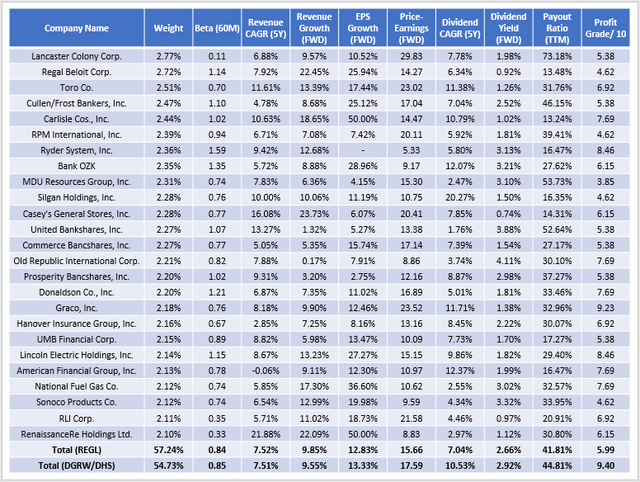
By opting for a 50/50 pairing of DGRW and DHS, investors substantially improve their portfolio’s profitability, which I believe is the key to long-term success. According to Seeking Alpha’s Profitability Grades, which I’ve normalized on a scale of 1-10, such a portfolio would score 9.40 compared to 5.99 for REGL. These metrics and others for REGL’s top 25 holdings are featured below.
The Sunday Investor
An additional benefit is that the portfolio’s volatility is just as low as REGL, as indicated by its 0.85 five-year beta. The DRGW/DHS combination also offers 7.51% historical revenue growth, 9.55% estimated one-year revenue growth, and 13.33% estimated one-year earnings growth, which are all similar to REGL. There’s a slight premium on the forward price-earnings ratio (17.59x vs. 15.66x), but dividend-focused investors will end up with a higher yield, both gross (2.92% vs. 2.66%) and net (2.59% vs. 2.26%), and a double-digit five-year dividend growth rate (10.53%). In both portfolios, payout ratios don’t appear threatened at 41.81% and 44.81%, respectively.
Industry Fundamental Analysis vs. VO, MDY
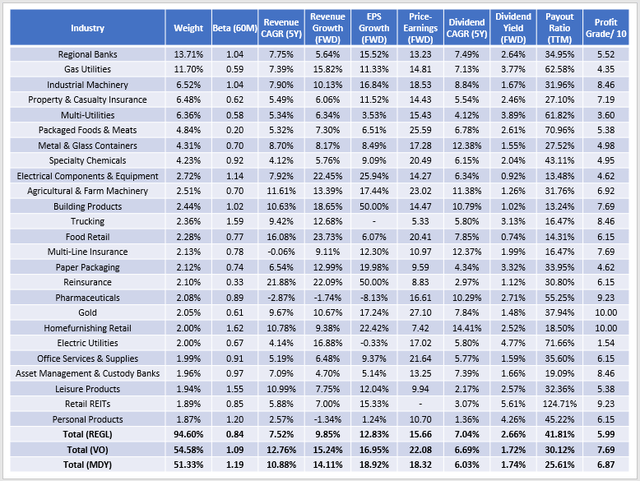
As mentioned previously, assuming you want to stay in the mid-cap space, REGL still looks like a solid choice. The low-volatility factor is difficult to come by. It suggests significant downside protection compared to other ETFs like VO and MDY, which have five-year betas of 1.09 and 1.19, respectively. Here’s a look at the fundamentals for REGL’s top 25 industries and how it compares against these peers.
The Sunday Investor
VO and MDY offer much higher growth potential, with estimated sales and earnings growth in the 14-15% and 17-19% range. They’re also much more diversified than REGL since only 50-55% of assets are in the top 25 industries compared to almost 95% for REGL. They also tend to hold more profitable companies. However, the discount on forward earnings, especially against VO (15.66x vs. 22.08x), is substantial and, I think, will continue to be valuable in the future.
Investment Recommendation
In this article, I looked at REGL from two perspectives. The first considered an investor who wasn’t explicitly looking for exposure to mid-cap companies. In that case, REGL didn’t stand out. An investor could easily combine DGRW and DHS to improve portfolio profitability while retaining REGL’s other features, including its low beta. The second perspective considered an investor wanting a dedicated mid-cap ETF for diversification purposes, and in that case, I found REGL to be an excellent choice. REGL routinely outperforms during drawdowns and has beaten the competition since its February 2015 launch. It’s also trading at a nice discount compared to its peers, which should help in a higher interest rate environment.
I favor highly profitable stocks and more substantial dividend growth, so my inclination is to rate REGL a hold and opt for the DGRW / DHS combination instead. However, that decision is based only on what’s available outside the mid-cap space, which some readers may find inappropriate. Still, I hope the information in this article will help you decide what’s best for your situation, and I’m happy to answer any questions you may have in the comments below.
[ad_2]
Source links Google News

