[ad_1]

deberarr/iStock via Getty Images
Last year, I wrote two articles discussing an exchange-traded fund designed to provide exposure to the shareholder yield theme, the iShares U.S. Dividend and Buyback ETF (DIVB). I concluded that though it has a few advantages like robust performance, relatively low fees of just 25 bps, and a large share of holdings with excellent profitability, investing in the S&P 500 exchange-traded fund (IVV) might make much more sense since it is well cheaper, while ~72% of its holdings (back then) did have shareholder yield large enough to qualify for the DIVB portfolio.
Today, I would like to share with my dear readers a few quick thoughts on its counterpart, the Invesco BuyBack Achievers ETF (PKW) which oversees a portfolio of around $1.5 billion.
Long story short, I believe this investment vehicle offers a suboptimal investment strategy and is better to be avoided. The principal Achilles’ heel is burdensome costs. It goes without saying that the primary staple of successful long-term passive investment is keeping expenses at bay, and that said, I am skeptical of paying 64 bps for a rather simplistic buyback-focused strategy, even assuming PKW did have a few banner years in the past, like 2019 and 2021, when it outperformed IVV by a few percentage points. However, a few advantages still can be spotted upon deeper inspection. Let us dig in.
How does PKW make investment decisions?
PKW’s investment mandate is to track the NASDAQ US Buyback Achievers Index. For a U.S.-incorporated (or certain benefit-driven countries, as mentioned in the methodology) company to qualify for inclusion, a 5% net reduction in shares outstanding in the trailing twelve months is a minimum threshold.
The benchmark is calibrated using modified market-cap weighting, with a 5% single-stock cap. It has been reconstituted just recently, in January, with numerous stocks added: the factsheet from December 31 showed 103 holdings, while the dataset I downloaded on January 31 contained 159 holdings (including cash).
More details can be found inside the prospectus and the index methodology.
Does concentrated buyback exposure translate into higher returns?
Anecdotal evidence suggests players systematically executing share repurchases thus pushing multiples down should outperform their counterparts that prefer to either retain cash or deploy excessive funds to dividends. In reality, the picture is less certain.
After reviewing PKW’s historical performance, I would say that mostly yes, it can deliver returns stronger than the 500 blue-chip cohort, but only at times. For example, PKW’s strategy worked well during the 2010s, but something tectonic happened in 2020, as the chart below illustrates.

PKW. IVV returns (Portfolio Visualizer)
It was clearly the great tech rally that catapulted the S&P 500 during the first year of the pandemic, while financials-heavy PKW lagged.
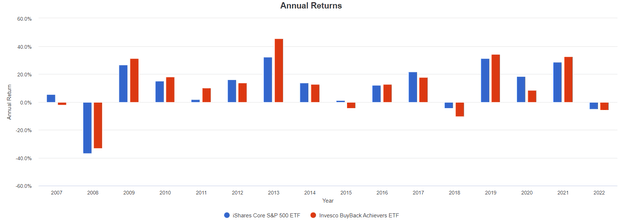
PKW, IVV annual returns (Portfolio Visualizer)
And though it moved up a gear in 2021, trouncing IVV, it is still anything but an alpha fund if assessed using 5-year returns.

Its YTD return is on par with IVV. The peers DIVB and the Cambria Shareholder Yield ETF (SYLD) fared better.
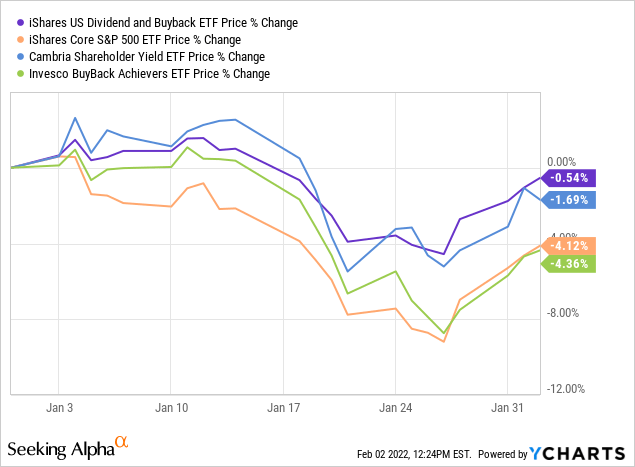
On a side note, investors should keep in mind that PKW is highly correlated with IVV, with a coefficient of 0.92, even despite the fact that only 44 stocks are present in both, with ~5% weight in IVV and ~78% in the Invesco BuyBack Achievers ETF.

Correlations for the period from 12 Dec 2006 to 1 Feb 2022, based on daily returns (Portfolio Visualizer)
What tilt does PKW have? Value? Growth? Quality?
As I said above, the PKW portfolio has recently been reshuffled, with the number of holdings surging to 158 (excluding cash). Bank of America (BAC) was its key investment as of January 31, with close to 5.4% weight. BAC announced a massive $25 billion share repurchase plan in April 2021.
All the trillion club members failed to qualify for inclusion in PKW’s benchmark, so with an ~$370 billion market cap, BAC is the most generously valued company in its portfolio. Among the smallest are seven micro-caps (below $300 million) like RCM Technologies (RCMT) and Elevate Credit (ELVT).
Overall, financial sector bulls will likely find PKW’s stock mix alluring since banks, insurance companies, and similar businesses from the sector account for over 30% of the portfolio. The data saved by the Wayback Machine show that in 2020, the ETF’s tilt towards financials was similar, with close to 31% allocated as of August 10.
For better context, it is worth noting that compared to IVV and DIVB, the fund substantially overweights financials, consumer discretionary, and materials, while reducing exposure to IT to the lowest level compared to the peers. Also, it holds no utilities.

PKW, DIVB, IVV sector exposure (Created by the author using data from the funds)
Now, let us discuss its exposure to the main factors. The Quant dashboard for the top 25 holdings is presented below.
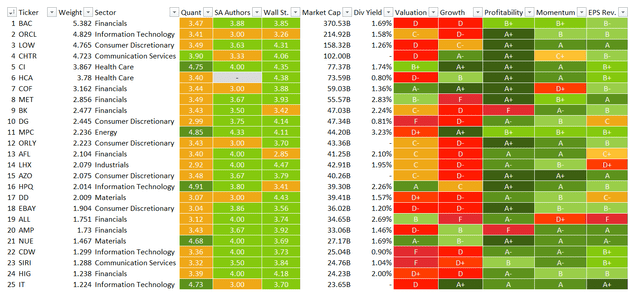
Quant dashboard for top 25 holdings of PKW (Created by the author using the data from the fund and Seeking Alpha)
As you might notice, these holdings that account for ~65% of the net assets mostly have a poor combination of slow growth and overstretched multiples, but the almost spotless quality makes the mix more balanced, reducing risks stemming from lackluster capital efficiency and fragile margins. Momentum is also remarkably strong for most, while the Wall Street pundits are overall optimistic on their earnings growth, except for L3Harris Technologies (LHX) and Allstate (ALL).
Overall, around 31% of the holdings have Valuation grades of B- or better, while close to 44% are seemingly overpriced. The takeaway is that the fund does not offer relative safety of value stocks that do not have thick growth premia, thus are less sensitive to multiples’ compression amid interest rates climbing higher. It also has substantial exposure to the growth factor, with 35% invested in stocks with at least B- Growth grade.
Finally, I would like to highlight its impressive quality, as almost 88% boast a Profitability rating of B- or better. This is consistent with the fund having larger exposure to the upper echelon and a comparatively smaller footprint in the medium- and small-size universe. 20 stocks with terrible quality are mostly mid- or small-caps.

Stocks with weak Profitability grades (Created by the author using data from Seeking Alpha and the fund)
Large exposure to high-quality stocks might hint most players in the basket have profits and cash flows large enough to deploy cash to buybacks consistently, without creating a precarious situation when debt funds are used to artificially inflate per share financial metrics.
Final thoughts
Summing up, the Invesco BuyBack Achievers ETF consistently overweights financial stocks, which resulted in negative price return in 2020 amid the ultra-loose monetary policy and its repercussions for banks, though this might be beneficial this year considering the forthcoming and long-overdue hawkish moves from the Fed that should finally quell inflation. This is the fund’s key advantage, but it does not make it a Buy.
Besides, it is worth noting that its peers like DIVB and SYLD are both cheaper, have slightly higher dividend yields, as well as stronger one-year and three-year performance.
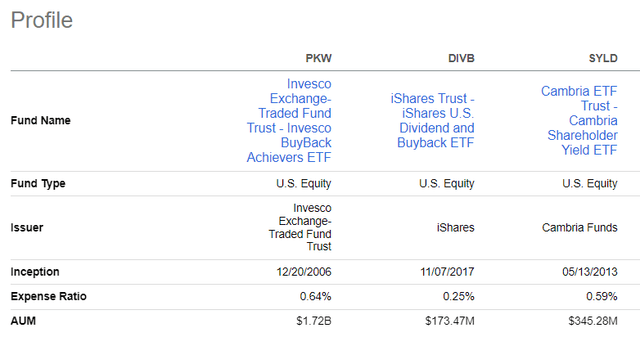
PKW, DIVB, SYLD comparison (Seeking Alpha)
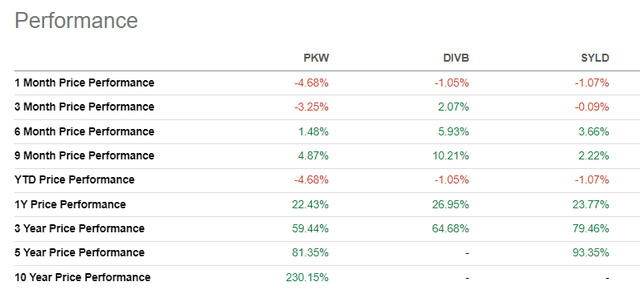
PKW, DIVB, SYLD comparison (Seeking Alpha)
In sum, I still think that ultra-low-cost bellwether funds are a choice superior to ETFs offering concentrated portfolios with exposure to companies that return cash to shareholders, especially those focusing on the buyback factor. PKW is a Hold.
[ad_2]
Source links Google News

