[ad_1]
When clients at my practice ask me for other alternatives to the traditional certificate of deposit or treasury option, short-term income ETF’s are always first that come to mind. One exchange traded fund caught my eye recently as it continues to grow in popularity and assets; The PIMCO Enhanced Short Maturity Active Exchange-Traded Fund (MINT). This fund has racked up almost $12 Billion in assets since its inception date in 2009. It’s easy to see why this fund has become so popular among short-term income investors and retirees. The six major bullet points that PIMCO wants you to takeaway are as follows:
1. Increased return potential
2. Capital preservation focus
3. Protection against rising rates
4. Liquidity for non-immediate needs
5. Compliments traditional bond funds
6. Low volatility in price
We will evaluate these major bullet points independently by running the risk metrics below.
30-Day SEC Yield Of 2.83%
This yield is most accurate when looking at what a fund pays. The distribution yield is helpful, but takes into account the prior twelve months of income, not the most recent dividend payouts. MINT is currently yielding an impressive 2.83%. What is also impressive about this exchange traded is that it pays the interest income monthly to shareholders. For those who are in retirement, this is a great way to produce cash flow more regularly to live off of.
Year-To-Date Performance
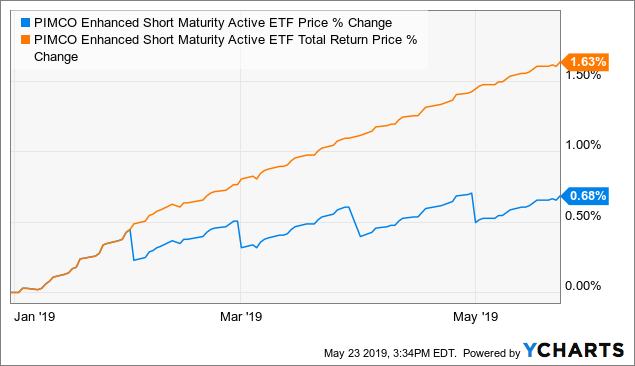
Lets take a look below at a few charts, brought to us from the folks at YCharts:
 Data by YCharts
When looking at this year’s numbers, you can see the total return that includes dividends is around 1.63%. A solid return for just half of the year vs. what you would earn for other banking options like CD’s.
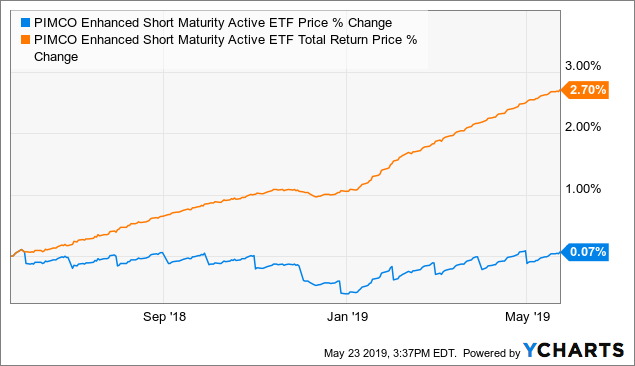
One-Year Performance
 Data by YCharts
The one-year performance of 2.7% is a great return for those wanting conservative income, and a monthly dividend stream.
MINT Risk Metrics
Anyone who is a follower of mine, knows I am all about running the risk metrics of any fund, or any financial instrument. Even though MINT looks like low risk from the cover, it is still important to take a look inside.
| Metric | Percentage |
|---|---|
| Arithmetic Mean (monthly) | 0.12% |
| Arithmetic Mean (annualized) | 1.42% |
| Geometric Mean (monthly) | 0.12% |
| Geometric Mean (annualized) | 1.42% |
| Volatility (monthly) | 0.13% |
| Volatility (annualized) | 0.46% |
| Downside Deviation (monthly) | 0.05% |
| Max. Drawdown | -0.55% |
| US Market Correlation | 0.39 |
| Beta(*) | 0.01 |
| Alpha (annualized) | 1.23% |
| R2 | 14.96% |
| Sharpe Ratio | 2.27 |
| Sortino Ratio | 5.52 |
| Treynor Ratio (%) | 72.52 |
| Calmar Ratio | 21,762,195.32 |
| Active Return | -11.70% |
| Tracking Error | 12.68% |
| Information Ratio | -0.92 |
| Skewness | 0.07 |
| Excess Kurtosis | 1.42 |
| Historical Value-at-Risk (5%) | -0.11% |
| Analytical Value-at-Risk (5%) | -0.10% |
| Conditional Value-at-Risk (5%) | -0.20% |
| Upside Capture Ratio (%) | 4.80 |
| Downside Capture Ratio (%) | -0.93 |
| Safe Withdrawal Rate | 10.85% |
| Perpetual Withdrawal Rate | 0.00% |
| Positive Periods | 93 out of 112 (83.04%) |
| Gain/Loss Ratio | 1.94 |
(Source: PortfolioVisualizer.com)
First glance at the risk metrics of MINT, you can see they are pretty straight forward. For sake of keeping this an easy to read article, lets take a look at a few important metrics for this fund. First off, the monthly volatility is coming in at .13%. For those investors who are very risk averse, this is a number you want to see. The fund is simply not volatile in price. This makes sense as well when you compare these numbers to the performance charts I have posted in the first section of the article. I always mention the beta reading of any investment when looking at the risks. The beta of this fund is a whopping .01 to equity markets. When searching for alpha or investments that are not correlated with equities, this is a great choice.
Next, we take a look at the annualized volatility measurement of the fund, coming in at .46%. The fund will increase and decrease in value not even half of one percent. This is another key metric for those seeking a very low volatile investment. Now that we have looked at monthly and annual volatility, we can look at the max drawdown reading. The max drawdown for MINT is reading -.55%. I have professionally never seen a fund with such a low reading. At any point in time over the past ten years, the fund has never lost more than half of one percent. This is great for income investors like myself, looking for stable income.
Summary
When looking for price stability in income producing funds, this ETF is a must look at. As interest rates are dropping again, its important to re-evaluate what you are earning on your short-term funds, and compare it to a fund such as the PIMCO MINT. When looking at the notes it owns, I like the fact PIMCO focuses on investment grade corporate notes, with yield to maturities of less than a year. If rates do rise long-term, this fund will be able to reset and purchase these higher yielding notes. One risk for investors to pay attention to is if rates rapidly decrease in value. The fund would then have to purchase notes at lower yielding values one year from now. I am not one to try and predict what interest rates are going to do, but long-term, rates could stay around these levels for a prolonged time, or increase. Either situation, short-term income ETF’s like MINT could produce steady dividends for income hungry investors.
Disclosure: I/we have no positions in any stocks mentioned, but may initiate a long position in MINT over the next 72 hours. I wrote this article myself, and it expresses my own opinions. I am not receiving compensation for it (other than from Seeking Alpha). I have no business relationship with any company whose stock is mentioned in this article.
Additional disclosure: Ortner Capital consults clients independently on owning exchanged traded funds. These opinions are that of Josh Ortner, CTFA, and not of PIMCO. Please consult your own professional before making any investment decision.
[ad_2]
Source link Google News

