[ad_1]

zbruch/E+ via Getty Images
The Pacer Global Cash Cows Dividend ETF (GCOW) is yet another value-tilting exchange-traded fund I would like to discuss today.
The fund was incepted in February 2016 and now oversees close to $230 million in net assets.
In essence, ~4% yielding GCOW favors the large-size factor mixing the U.S. and international equities meticulously selected using multi-step screening for high FCF and dividend yields, while also not compromising on quality (thanks to FCF/EV used to minimize the risk of being overexposed to the enterprise value problem). The fund intentionally ignores financials except for REITs owing to limitations of the FCF yield valuation method.
What might look like a value and quality-focused dividend investor’s dream strategy at first blush is certainly not entirely faultless. The major downside I see here is its expenses of 60 bps which are amongst the highest in the class. It also should be noted that compared to the dividend ETFs I cover, GCOW is close to the top of the list in terms of the ERs, with only two emerging market equities-focused vehicles having higher fees, namely the
- Global X SuperDividend Emerging Markets ETF (SDEM), 67 bps,
- WisdomTree Emerging Markets High Dividend ETF (DEM), 63 bps,
plus First Trust Value Line Dividend ETF (FVD) with its 70 bps.
Past performance is yet another disappointment, as it lagged not only the Russell 1000 (hence, the S&P 500 too) but also a few selected international equity peers, though I am skeptical about simply extrapolating its late-2010s results to the 2020s, as factors that were hurting its returns previously are now wilting, while cheap valuation seemingly once again attempting a revival, like a year ago when we noticed a rotation from the pandemic champs to cyclicals.
Now let us dig in and assess the fund in greater depth.
Investment strategy
Most value strategies utilized by passive ETFs do not pay proper attention to cash flows, an essential driver of a stock’s intrinsic value and number one metric for a skilled contrarian investor, either adding them as a minuscule component in a composite score used in a stock-picking process or ignoring them completely. Skewed results and chronic underperformance are more likely amongst direct effects. That is not the case with GCOW.
The selection pool for its underlying index consists of the constituents of the FTSE All-World Developed Large Cap Index. Unfortunately, I am not aware of any passive ETFs that seek to mimic investment results of this benchmark, so I opted for the iShares MSCI World ETF (URTH), a fund with a similar international focus (with U.S. stocks while shunning emerging markets) though without the large-cap filter, in the section below where I will be discussing how GCOW performed compared to peers and broader alternatives.
The candidates undergo an average projected FCF and earnings (in case estimates are available) test, with the data considered “over each of the next two fiscal years.” Those that are anticipated to outspend cash flow and stay/become unable to deliver even thin profits are banished from the universe. Besides, due to the limitations of the FCF method that does not work for banks and the like, financial companies with the exception of REITs are also apparently removed.
Now, a much leaner list faces yet another test, when those remaining are ranked by their TTM FCF yields defined as FCF divided by enterprise value, and the best 300 proceed to the next step when they are ranked by the dividend yields. Finally, 100 top payers (hence, more likely most undervalued) qualify for inclusion. And since FCF-negative companies are prudently banned on step one already, the possibility of value/yield traps somehow creeping into the GCOW portfolio drops materially compared to those high-yield strategies that chase payouts while failing to observe if they are durable.
The index is rebalanced and reconstituted biannually, in June and December. Stock weights are assigned based on the TTM dividends paid, with a 2% individual company cap. More details can be found in the prospectus and the index methodology provided by Index Design Group.
A brief view on returns
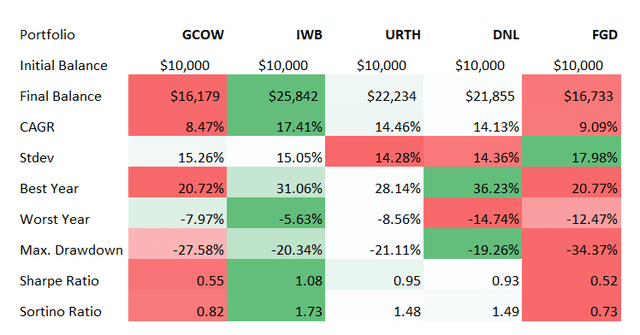
GCOW’s performance since inception was rather soft in terms of cumulative returns, as well as with a higher level of risk compared to the selected peers including the WisdomTree Global ex-U.S. Quality Dividend Growth Fund (DNL) and the First Trust Dow Jones Global Select Dividend Index ETF (FGD).
The table below summarizes key metrics for the March 2016 – January 2022 period. As you can see, GCOW’s CAGR is the weakest, while the Sharpe and Sortino ratios are clearly lackluster (as a reminder, at least 1 for the former and 2 for the latter are considered optimal), though they are worse for FGD.
Created by the author using data from Portfolio Visualizer
That’s especially strange since DNL managed to outperform GCOW even without the footprint in the U.S. and despite exposure to risky EMs.
But we see tables have turned recently, with the fund thriving while the Russell 1000 (IWB) is languishing. COWZ, its U.S.-focused peer, has also managed to eke out a marginal gain.
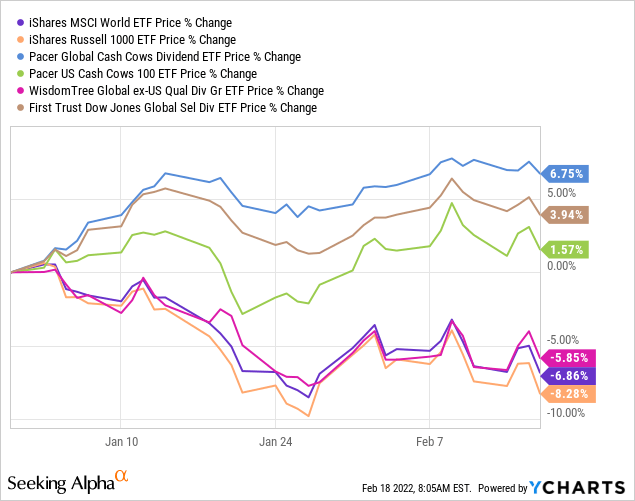
In my view, GCOW’s large exposure to materials and energy is the top factor contributing here. Tempestuous start to 2022 has revealed the vulnerabilities of the high-multiple investing while allowing value stocks to regain ground, and GCOW’s recent performance likely reflects that. This, in turn, instills some confidence that gains may last should the capital rotation persist.
Holdings, Shortly on factors
As of February 17, GCOW had a portfolio of 100 stocks, with the top ten accounting for slightly above 20%.
Its top holding is British American Tobacco (BTI), a consumer staples company boasting almost 35% FCF margin and ~6.3% dividend yield. In sharp contrast to pure-growth names and growth-heavy IWB, BTI’s price has been on a tear this year.
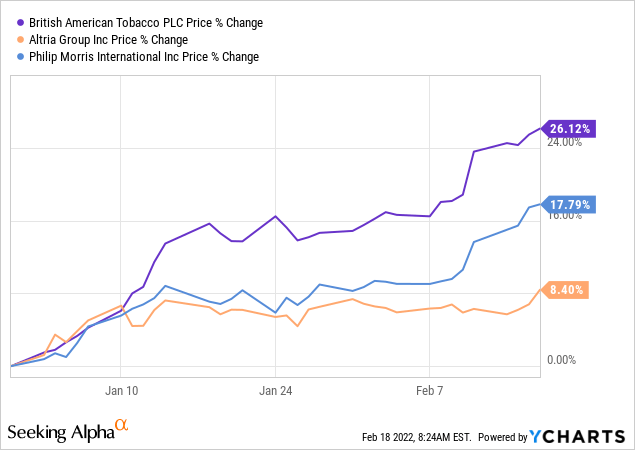
It is worth noting that its key peers Altria (MO), Philip Morris (PM), and Japan Tobacco (OTCPK:JAPAF) have also qualified for inclusion.
In terms of geographical footprint, GCOW maintains large exposure to the U.S., with ~32.3% allocated as of end-2021. The U.K. came in second place with ~18.7%, followed by Japan with its ~14%. I highlight it as a risk worth remembering as the yen does not look appealing at all in an environment where U.S. interest rates creep higher. I am also skeptical about the pound sterling.
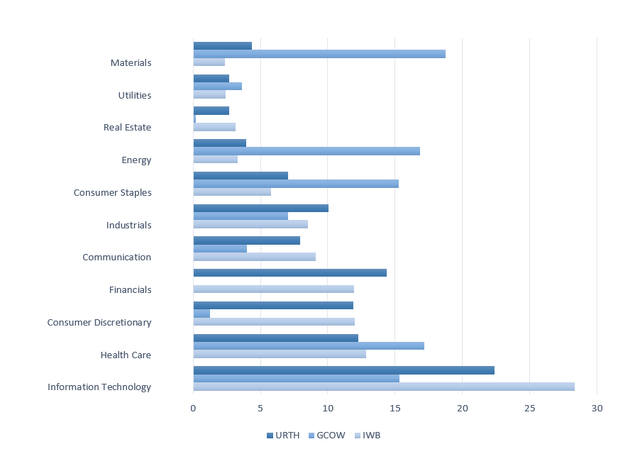
The chart below compares sector allocations of IWB, URTH, and GCOW.
Created by the author using data from the funds
The key takeaway is that GCOW is grossly overweight consumer staples, materials, and energy, underweight consumer discretionary, obviously with no financials in the mix.
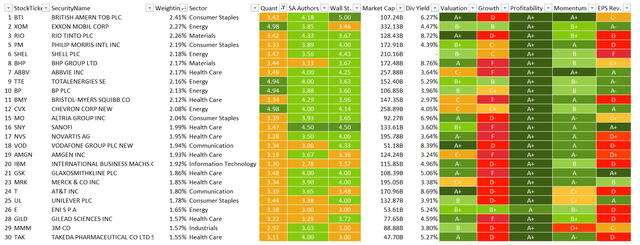
Approximately 63% of its holdings (I adjusted no tickers this time) are covered by the Quant rating. The results of the Quant analysis are expectable: the impressive level of quality (all the stocks covered by the QR have A (-/+) Profitability grades) is supported by the strategy mindful of FCF, while valuation (~50% have an at least B- grade) is also attractive for the exact same reason plus because of the high yield screen added. Meanwhile, growth investors will be disappointed as ~44% of the holdings have utterly lackluster Growth grades (D+ or worse), which is anything but a surprise for a high-yield equity mix.
Below is the summary of the Quant factors for 25 GCOW’s holdings with ~50% weight.
Created by the author using data from the fund and Seeking Alpha
Final thoughts
- GCOW appeals to value investors seeking high yields backed by durable business models both in the U.S. and overseas.
- In my article on COWZ, I highlighted its high turnover as a factor that can possibly reduce performance going forward. GCOW has a more adequate turnover of 76% (per the prospectus), though still rather elevated.
- I like its close to 4% TTM yield, though costs are burdensome, which is a headwind for the standardized yield.
- Anyway, I believe its high-yield strategy mixing value and quality with due attention to cyclical sectors should do well in 2022 even despite FX risks.
[ad_2]
Source links Google News

