[ad_1]

TriggerPhoto/iStock Unreleased via Getty Images
Introduction
The roller coaster ride of the markets has led to many investors seeking some level of certainty and a buffer against volatility. Realistically, this can be achieved through two methods:
- Seeking relative outperformance against broad indices rather than absolute returns.
- Returning to fundamentally-backed valuation bases and companies that generate cash distributions to investors.
On this note, the ProShares S&P 500 Dividend Aristocrats ETF (NOBL) should be examined. Firstly, companies with a tradition of dividend payments offer at least some cash flow certainty to investors and need to have fundamentally strong financials to do so. Furthermore, while US Treasury yields may be rising in the interim and lessen the attractiveness of dividend stocks, dividend companies are purchased for their potential capital gains apart from their income generating ability.
The relative performance argument
A simple way to gauge the sensitivity of NOBL against market swings is by measure the beta of NOBL against broad market indices. NOBL has a beta of 0.948 over the last five years against the S&P 500. This suggests that NOBL is closely correlated with the S&P 500 but would not move in lock step. Against the Dow Jones index, NOBL has an even lower beta of 0.901.
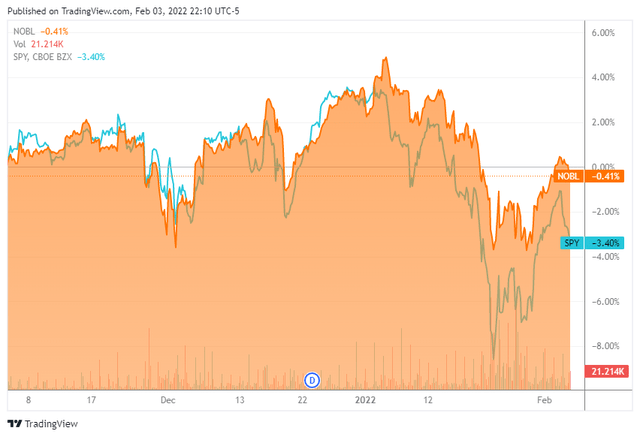
Exhibit 1 below reaffirms the idea that NOBL would outperform the general S&P 500 on the basis of its lower beta and extension, lower volatility. Lower volatility is preferred during market downtrends, such as the experience over the last three months (note: the Relative Strength Index, or RSI, peaked in early November). During this period, the SPY as the ETF proxy for the S&P 500 returned -3.40% against NOBL which outperformed with a smaller loss of -0.41%.
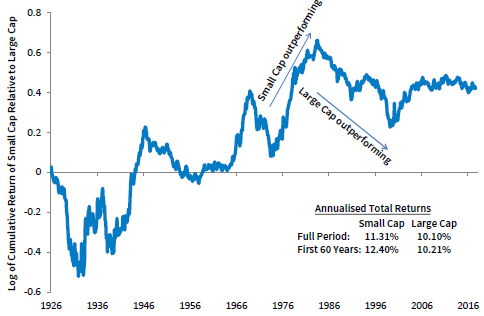
Another reason for investing in ETFs that track the S&P 500 is the relative outperformance of large caps during market downcycles, as shown in Exhibit 1 below. Since the S&P 500 (SP500) is weighted by market cap and the leading companies listed in the US, the S&P 500 is a good proxy to ride on large cap outperformance during jittery markets.
Exhibit 1: Outperformance of NOBL against SPY during the present market downtrend

Outperformance of NOBL against SPY during the present market downtrend (Seeking Alpha, by Trading View)
Source: Seeking Alpha
The next question would be, why would anyone bother to invest in NOBL when even lower beta investments can be selected? Firstly, NOBL allows exposure to the S&P 500 which outperforms over most active managers over the long term. Numerous research on this has been done and one example can be found in this article. Of course, this logic relates better to relative return investors rather than those seeking absolute returns, and for investors who believe in the S&P 500’s long term outperformance.
Exhibit 2: Cumulative Relative Returns for US Small Cap vs. Large Cap Stocks 1926 – 2017

Cumulative Relative Returns for US Small Cap vs. Large Cap Stocks 1926 – 2017 (AXA Investment Managers)
The fundamental valuation argument
Lately, there has been much discussion over valuations being attractive with many Wall Street strategists suggest that investors “buy the dip”. At present, the S&P 500 is trading close to 1 standard deviation below its two-year mean, at 23.6 times P/E (two-year mean: 26 times P/E). Therefore, not only is the S&P 500 trading at a below average P/E ratio, it is trading at a below average P/E ratio measured through the COVID pandemic. As such, the market valuation is pessimistic and gives very little benefit to a recovery and mid-term election year.
Individual companies in the NOBL ETF provide comfort that the industries are traditional brick-and-mortar companies, shown in Exhibit 3. This is an important attribute during the current rotation out of moonshot equities and overvalued stocks in the tech sector – the most recent example of this disdain for such companies was the precipitous 26% decline of FB on 3-Feb-2022. According to Seeking Alpha and Wall Street analyst ratings, the average rating of the top ten stocks held by NOBL ETF are in the “buy” zone. Furthermore, brick-and-mortar sectors such as packaged foods & meats, household products and building products are sectors that offer a high degree of earnings certainty and dividend safety.
Exhibit 3: Key fundamentals of top ten companies in NOBL ETF
|
Symbol |
Weight % |
SA authors |
Wall Street |
Dividend Yield % (FWD) |
Industry |
|
AOS |
1.90 |
3.50 |
3.57 |
1.51 |
Building products |
|
ABBV |
1.83 |
3.90 |
4.25 |
4.01 |
Biotechnology |
|
MKC |
1.77 |
3.00 |
2.76 |
1.44 |
Packaged foods & meats |
|
GWW |
1.75 |
3.00 |
3.29 |
1.28 |
Trading companies and distributors |
|
HRL |
1.71 |
4.00 |
2.84 |
2.18 |
Packaged foods & meats |
|
PG |
1.71 |
3.20 |
3.78 |
2.12 |
Household products |
|
SHW |
1.69 |
3.33 |
3.67 |
0.76 |
Speciality chemicals |
|
ADP |
1.67 |
3.28 |
2.94 |
2.03 |
Data processing & outsourced services |
|
CL |
1.67 |
3.00 |
3.5 |
2.18 |
Household products |
|
LOW |
1.67 |
3.66 |
4.25 |
1.37 |
Home improvement & retail |
|
Simple average |
3.387 |
3.485 |
1.89 |
Source: Seeking Alpha, author’s compilation
Should we fear rising interest rates and Treasury yields?
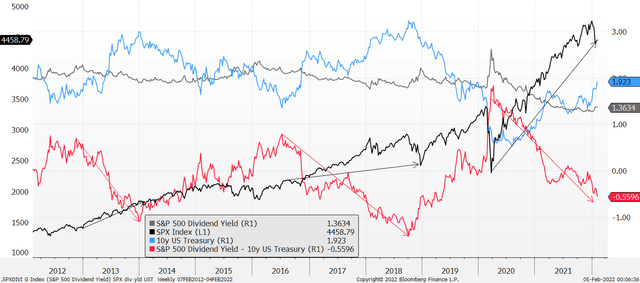
Being a low yielder, there are arguments that rising interest rates and Treasury yields would cause an allocation shift towards higher yielding assets, US Treasuries and fixed income. However, this has historically not been the case, at least not in a prolonged fashion. The arrows on Exhibit 4 shows that between 2016 and 2018, as well as 2020 and 2021, although the S&P 500 dividend yield over the ten-year treasury spread declined, the ongoing uptrend in the S&P 500 was largely intact. A simpler explanation would be to note that US Treasury yields of over 2% in 2017 did not prevent the stock market from rising. However, the caveat is that there were a couple of months of decline after a prolonged uptrend – therefore, what is being experienced since 4Q2021 appears to be a repeat of 4Q2018.
There are also arguments that rising inflation would erode the real returns of low yielding assets. However, I would agree with this argument in part for fixed income markets, and not necessarily for large cap dividend equities that stand to gain from future capital gains as earnings continue to grow alongside valuations. I would rather reserve such worries for moonshot equities and small cap stocks. As depicted in Exhibit 4, the secular uptrend of the S&P 500 remains intact and as long as one is not trying to trade in and out of mini-cycles, a buy-and-hold strategy on the S&P 500 remains attractive in the long term.
A major reason for the volatility in the stock market is likely a function of surprises by the Federal Reserve (aka policy mistakes) – the latest hawkish turn by the Federal Reserve (being more aggressive on tapering and the expected balance sheet run off) and the confusion over initial expectations of “transient” inflation. The market would likely have performed better and the Federal Reserve would have some semblance of approaching its inflation goals methodically if earlier communications were more proactive rather than reactive.
Exhibit 4: There is limited evidence that a drop in the S&P 500’s dividend yield relative to the US Treasury yield would lead to lower index level

Exhibit 4: There is limited evidence that a drop in the S&P 500’s dividend yield relative to the US Treasury yield would lead to lower index level (Bloomberg)
Source: Bloomberg, author’s annotations
Conclusions
The market continues to react to the Federal Reserve’s variegated communication and the collapse of moonshot equities in the tech sector. However, the S&P 500 and even safer bets such as NOBL that tracks dividend stocks in the S&P 500 have been dragged down. This presents an opportunity to separate the wheat from the chaff and the NOBL ETF that provides exposure to large cap dividend stocks in the S&P 500 provides some comfort during volatile times in the market. Research has shown that large cap stocks tend to outperform small cap stocks during market declines and over the long term, the S&P 500 is likely to continue on its secular uptrend.
[ad_2]
Source links Google News

