[ad_1]
Mark Wilson/Getty Images News
Investment Thesis
The Vanguard Mega Cap Value ETF (NYSEARCA:MGV) and the iShares MSCI USA Value Factor ETF (BATS:VLUE) look similar in many respects. Each holds large-cap stocks, is well-established with a low expense ratio, has roughly the same number of holdings, and has a similar performance track record. So today, I want to take a closer look under the hood to identify the key differences I think will be helpful to value investors. In the end, I will make a recommendation on which one I favor and the factors I believe will be the most important for the remainder of the year.
Strategy, Sector Exposures, and Top Holdings
Vanguard Mega Cap Value ETF
MGV tracks the CRSP U.S. Mega Cap Value Index, which allows some overlap between mega- and large-cap stocks. Therefore, it’s not a pure mega-cap ETF and holds stocks with market capitalizations as low as $16 billion. CRSP constructs and weights its factor-based Indexes by calculating a value and growth score based on five traditional metrics:
- Book to Price Ratio
- Future Earnings To Price Ratio
- Historical Earnings To Price Ratio
- Dividend To Price Ratio
- Sales To Price Ratio
Details on each of these metrics is provided below. I believe the use of future consensus earnings targets is advantageous and essential as value stocks become more favored. If the Index used trailing earnings instead, some poor growth stocks could sneak into the fund because of historically solid earnings.
CRSP Indexes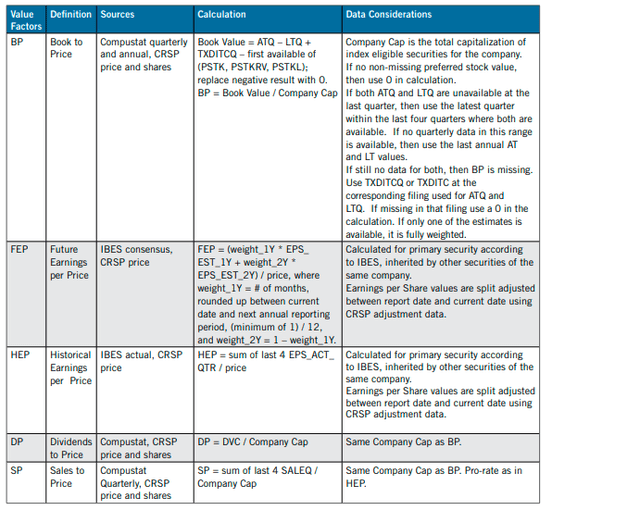
MGV has 147 holdings, with 26.48% allocated to the top ten. Warren Buffett’s Berkshire Hathaway (BRK.B) and JPMorgan Chase (JPM) are the two biggest holdings in the Financials sector. Also, there are four Health Care names: UnitedHealth Group (UNH), Johnson & Johnson (JNJ), Pfizer (PFE), and AbbVie (ABBV). The 22 Health Care holdings form MGV’s largest exposure area.
Vanguard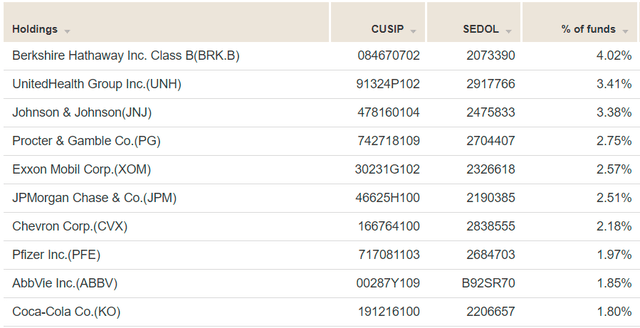
iShares MSCI USA Value Factor ETF
Effective September 1, 2015, VLUE began tracking the MSCI USA Enhanced Value Index after previously tracking the MSCI USA Value Weighted Index, selecting large-cap value stocks based on three criteria:
- Price-To-Book Value
- Price-To-Forward Earnings
- Enterprise Value-To-Cash Flow From Operations
Unlike the Vanguard U.S. Mega Cap Index, MSCI Enhanced Indexes are constructed with a fixed number of securities, though selections and weightings are based on each security’s final value score. MSCI Enhanced Value Indexes rebalance on the last business day of May and November.
VLUE’s top ten holdings are much different than MGV’s and include four technology stocks: Intel (INTC), Micron Technology (MU), Cisco Systems (CSCO), and International Business Machines (IBM). Generally, this structure means extra risk, and I’ll be highlighting that later in my fundamental analysis comparison of the two ETFs.
iShares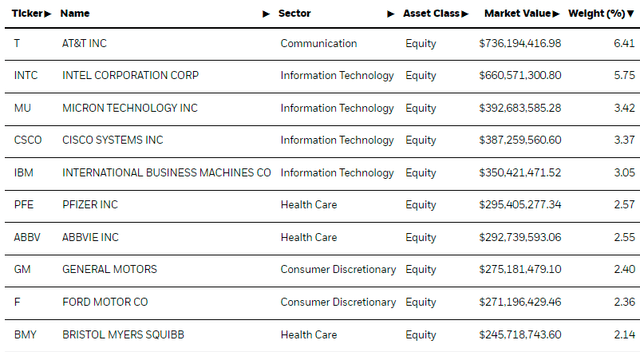
The table below highlights each ETF’s sector exposures alongside the SPDR S&P 500 ETF (SPY). VLUE’s total exposure to Technology is 28.83% or about 19% more than MGV’s. MGV has more exposure to Financial and Health Care stocks that typically sport low valuation ratios. Traditional value investors probably prefer MGV’s setup, but VLUE could be an attractive option for those not wanting to deviate much from S&P 500 weightings.
Morningstar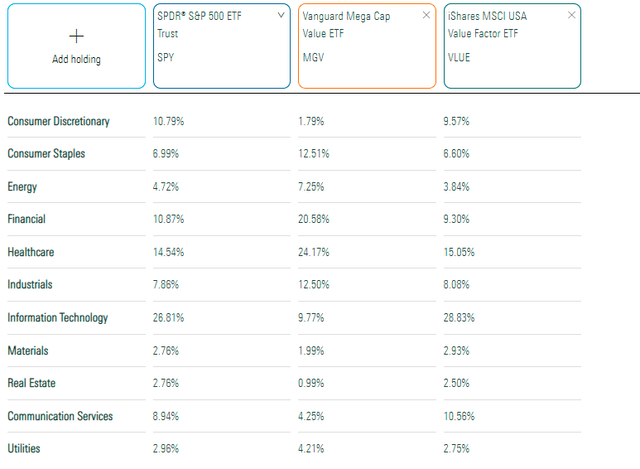
Performance Analysis
The graph below highlights the historical performance of MGV, VLUE, and SPY since May 2013, coinciding with VLUE’s launch. MGV has been the better performer in terms of both risk and returns. As a result, risk-adjusted returns as measured by the Sharpe and Sortino Ratios were far superior.
Portfolio Visualizer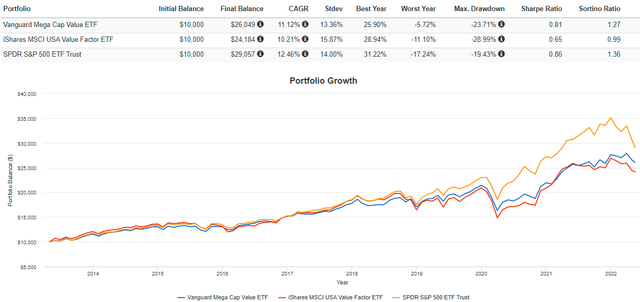
It’s well-known how the Federal Reserve dramatically expanded its balance sheet in response to the COVID-19 pandemic. The expansion rate was unprecedented, with total assets increasing from $4.2T in March 2020 to $8.9T today. This support props up stock markets, but Chairman Powell has firmly indicated the Fed is committed to tackling inflation through increased interest rates. Should this result in a recession, so be it. At least, that’s my read.
The Federal Reserve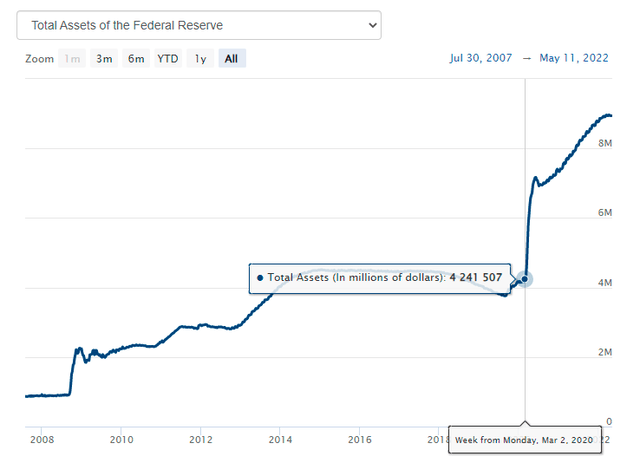
As a result of this balance sheet expansion, tech-heavy Indexes like the Nasdaq-100 and, to a lesser degree, the S&P 500 performed exceptionally well in 2020 and probably better than they deserved. SPY gained 18.37% compared to 2.44% and -0.24% for MGV and MGC. However, now that the Fed’s balance sheet is shrinking, it’s not unreasonable to expect a reversal in fortunes for value ETFs. Already in 2022, SPY has underperformed MGV and VLUE by 11.52% and 7.08%.
VLUE’s performance only extends to 2013, but MSCI provides backtested annual returns for its Enhanced Value Index to 2008. I want to emphasize that I won’t rely on backtested results to form my conclusion since backtested results are often unrealistic and misleading. Still, the results are fascinating. They indicate that in 2008, VLUE would have fallen by 36.94% (excluding fees) while MGV lost 35.64%. In 2015 and 2018, the Enhanced Value Index lost 6.38% and 11.06%, while MGV fell 0.20% and 4.10%. Including 2022, that’s three consecutive years of market declines where MGV performed better.
MSCI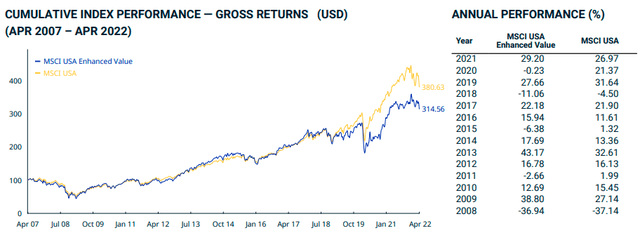
However, VLUE’s hypothetical returns were much better in bull markets. For example, in 2009, its Index gained 38.80% compared to MGV’s 15.73%. It also outperformed by 11% in 2013 and 5% in 2014 and 2017. Over the long run, VLUE hypothetically would have won out, gaining an annualized 9.73% vs. 8.42% for MGV. I’ve reflected this growth in the graph below.
The Sunday Investor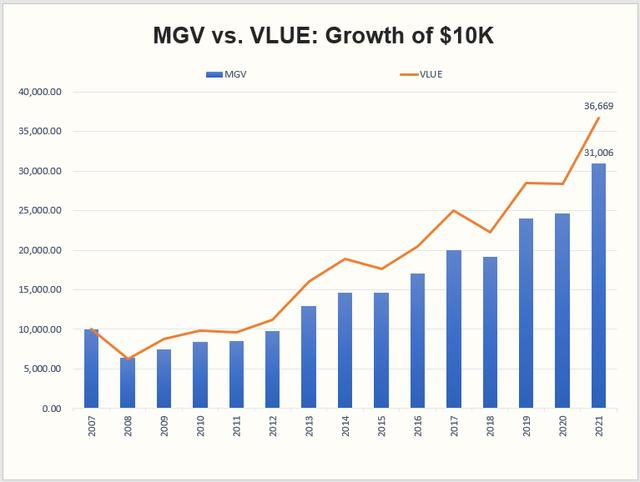
Again, these results aren’t real, and you should take them with a grain of salt. I prefer to look at each ETF’s fundamentals to understand better the value they bring to the table, so let’s do that next.
Fundamental Analysis
MGV Industry Snapshot
I decided to analyze each ETF at the industry level since they are both well-diversified, and thus, examining the top holdings would be insufficient. I’ll start with MGV, whose top 20 industries cover 70% of its total, and it’s clear the portfolio is bolstered by the defensive Pharmaceuticals industry (JNJ, PFE, LLY, and MRK). Notice the industry’s low five-year beta (0.57), double-digit estimated revenue and EPS growth rate (10.38% and 14.24%), reasonable forward price-earnings ratio (17.80), and excellent Seeking Alpha Profitability Grade (A+). Despite being defensive, these stocks earned a weighted-average return of 123.51% in the last five years, 43% better than SPY.
The Sunday Investor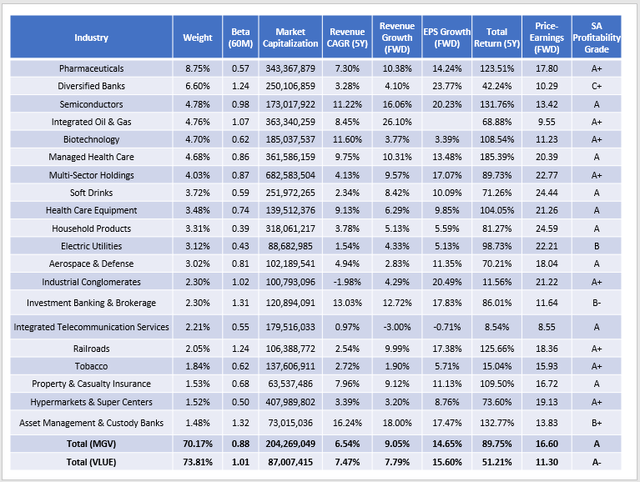
Though Pharmaceuticals are strong, Diversified Banks have struggled in the last five years. The large gap between estimated revenue and EPS growth reflects the higher margins banks should earn as interest rates rise. However, banks are looking increasingly riskier, especially after poor earnings results in retail stocks led to a broad market selloff on Wednesday. Banks reflect the economy’s health and tend to be riskier investments, as reflected in MGV’s 1.24 beta figure for that industry. Apart from that, I don’t see many significant risks, apart from other Financials-related industries like Investment Banking & Brokerage and Asset Management & Custody Banks. There’s a case to be made that the Household Products industry could struggle too. Procter & Gamble (PG), Kimberly-Clark (KMB), and Colgate-Palmolive (CL) sell necessities but could see margins squeezed even tighter due to high inflation.
Overall, MGV has a five-year beta of 0.88, putting it firmly in the lower-risk category. Its weighted-average market capitalization is over $200 billion, which goes hand in hand with its excellent “A” Seeking Alpha Profitability Grade. Larger companies have access to better financing and are generally in good financial shape. With this strategy, you probably won’t earn abnormally high returns, but there’s nothing wrong with insisting on high profitability for the core part of your portfolio. Out of 147 holdings, only two reported a negative EPS last quarter: Las Vegas Sands (LVS) and Lucid Group (LCID), an EV automobile manufacturer. Thankfully, these only account for 0.05% of MGV. Also, 77.77% of the ETF has grown earnings per share over the last three years. For me, it’s comforting to know that most companies in MGV have increased profits despite a pandemic and sky-high inflation.
Finally, the fund’s revenue and earnings per share growth rates look pretty strong at 9.05% and 14.65%, respectively. The price-earnings ratio of 16.60 is also low and about average for the large-cap value category. I have 30 of these ETFs in my database, and MGV is the 14th cheapest on this metric.
VLUE Industry Snapshot
This next table highlights the same metrics for VLUE’s top 20 industries. Instead of Pharmaceuticals and Diversified Banks, VLUE is heavy on Semiconductors, Integrated Telecommunication Services, and Biotechnology stocks. The top semiconductor stock is Intel (INTC), which happens to have a very low 0.60 five-year beta. As you may know, the semiconductor industry is dealing with severe supply chain issues, so it makes sense to have exposure in this area. However, Intel has been a terrible performer relative to other stocks in the industry. To illustrate, Intel only gained 36.66% in the last five years compared to 189.89% for the SPDR S&P Semiconductor ETF (XSD), which weights its constituents equally.
The Sunday Investor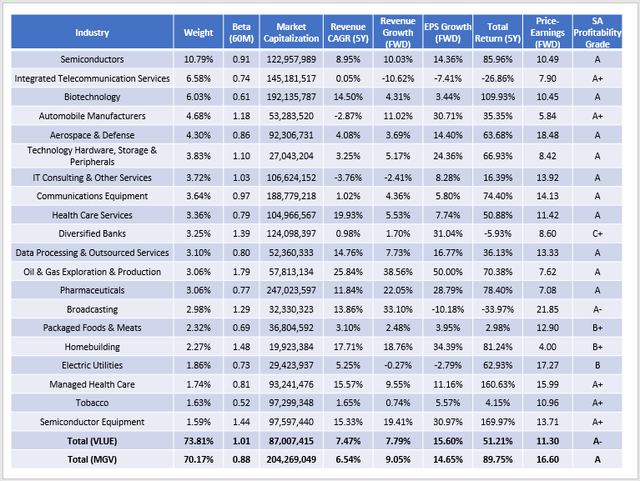
This “select poor past performers” strategy appears prominent in VLUE. Overall, its weighted-average five-year returns were only 51.21% compared to 89.75% for MGV. It’s also reflected in the 11.30 forward price-earnings ratio, the cheapest in my database. Therefore, I’m reasonably confident VLUE is a deep-value ETF. Such a strategy may work out, but I caution readers about how long that can take. Besides, there are deep-value ETFs in other categories worth checking out if you don’t mind higher volatility. I’ve recently reviewed the Cambria Shareholder Yield ETF (SYLD) and the Pacer US Cash Cows ETF (COWZ), so I hope you’ll check out those articles later.
Another key difference is VLUE’s much lower weighted-average market capitalization of $87 billion. That’s still easily in large-cap territory, but it’s in the bottom 20% of the category. As discussed previously, the result is often a lower profitability grade. While 77.77% of constituents by weight in MGV grew earnings per share over the last three years, the same is true for only 59.58% of VLUE. In other words, the market wasn’t irrational for capping these stocks’ valuations, resulting in returns 38% worse over the last five years.
Investment Recommendation
As the Federal Reserve raises rates and unwinds its 8.9T balance sheet, I think value stocks will continue to outperform growth stocks. MGV and VLUE are two ETFs likely to participate in that outperformance, but MGV looks like the better choice at the moment. It has a lower five-year beta, owns highly profitable stocks that can weather an economic downturn, and has an attractive 16.60 forward price-earnings ratio.
VLUE also can perform well, especially if low P/E stocks continue to be favored. Like MGV, it also has solid estimated revenue and earnings per share growth rates, so it should be able to participate nicely in bull markets. However, profitability is a potential issue since only 59.58% of holdings by weight managed to grow earnings per share over the last three years. As a result, VLUE’s current portfolio doesn’t have a great five-year track record, underperforming MGV’s by 38%. I’m all for buying quality stocks at a discount, but VLUE is too much of a deep-value ETF today for my liking. Therefore, I rate MGV as a buy and VLUE as a hold, and I hope to continue the conversation in the comments section below.
[ad_2]
Source links Google News

