[ad_1]

Enes Evren
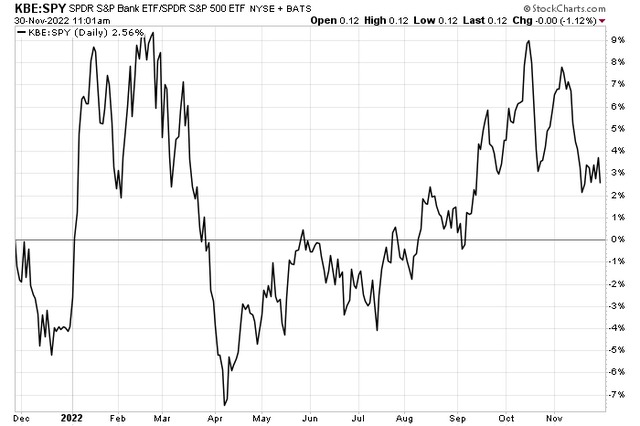
Banking stocks had been outperforming the S&P 500 in 2022. I was bullish on the space back in September, and while one popular industry ETF has had a positive return since that report, it has not provided much in the way of alpha against the broad market.
Lower intermediate-term interest rates have hurt some regional banks and thrift institutions versus the sharply rising rate environment seen earlier in the year. Let’s reassess KBE as we approach year-end.
KBE Losing Relative Strength Vs. SPY
StockCharts.com
According to SSGA Funds, the SPDR S&P Bank ETF (NYSEARCA:KBE) offers investors exposure to the bank segment of the S&P total market index, which comprises the following sub-industries: asset management and custody banks, diversified banks, regional banks, other diversified financial services, and thrifts and mortgage finance sub-industries. The index KBE tracks features a modified equal-weighted scheme which provides the potential for unconcentrated industry exposure across large, mid, and small-cap stocks.
With just a 0.35% annual expense ratio and 100 holdings, KBE has reasonable costs and diversification. What I also continue to like about this niche of the domestic equity market is that the S&P bank industry features a low 9.6 forecast price-to-earnings ratio with robust per-share profit growth of 7.3% over the coming three to five years, per SSGA. The ETF is large and established with more than $2.1 billion in assets under management and a median 30-day bid/ask spread of just 0.02%
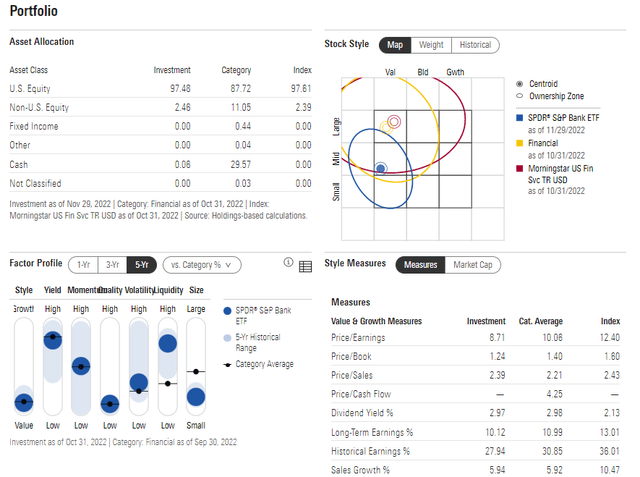
Digging into the portfolio, KBE sports a 3.0% dividend yield, according to Morningstar. On the style map, you will find the KBE portfolio resembling a mid-cap value fund with some crossover into small-cap value. Expect the fund to do relatively well when interest rates rise and corporate lending activity picks up. The small median company size of the ETF’s holdings makes it exposed to the U.S. economy, given its equal-weight nature. With a high yield and low quality, economic turmoil could hit shares hard, though.
KBE: Factor Profile & Portfolio Statistics
Morningstar
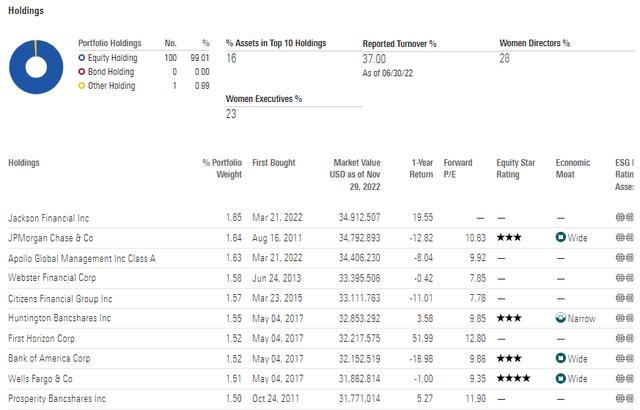
Investors can take some solace in KBE’s diversification within the industry, but that also means some quite small, and potentially volatile, stocks have a greater impact on the share price than market-cap-weighted ETFs.
KBE: Portfolio Holdings
Morningstar
The Technical Take
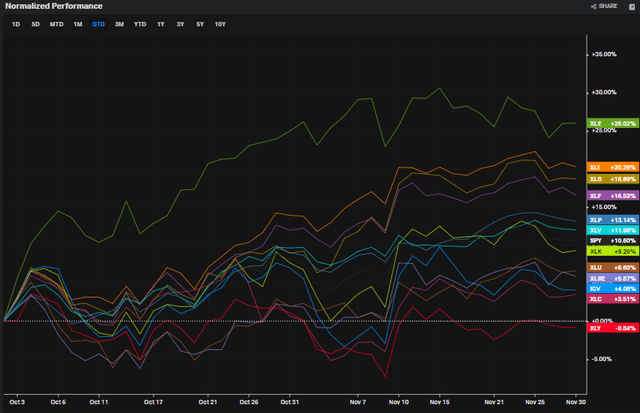
KBE’s relative strength peaked in October, right around the all-important September CPI report that marked at least a near-term low in the S&P 500. Other value areas like the Industrials, Materials, and Energy sectors have done well in the last six weeks. Financials have lagged those leading areas modestly, but I see some bearish risks on an absolute basis.
Q4 Returns: Financials Strong, But Lag Other Value Sectors
Koyfin
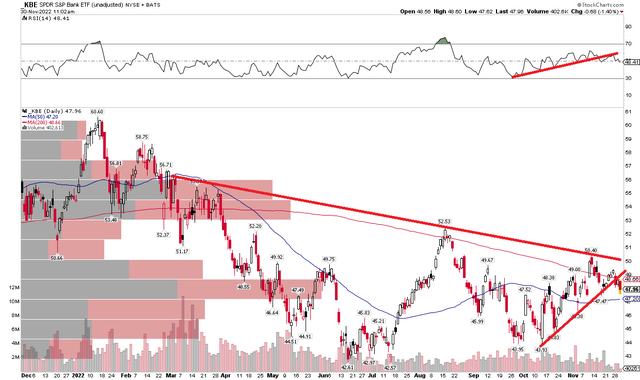
The chart shows KBE failing to climb above its 200-day moving average right now. That comes after a bearish price reversal back in September. Now I see shares potentially breaking down below a key short-term uptrend line. Moreover, KBE’s RSI line at the top of the chart appears to have already broken its uptrend. Momentum is thought to turn before price. So, there are definitely some reasons for caution on the fund.
KBE: Shares At Risk Of Near-Term Downside After Failing At The 200dma
StockCharts.com
The Bottom Line
I still like KBE’s low valuation and earnings growth outlook, but the chart now suggests investors take a shorter-term wait-and-see approach. If the fund indeed turns lower, look to buy the dip on an approach of $43.
[ad_2]
Source links Google News

