[ad_1]
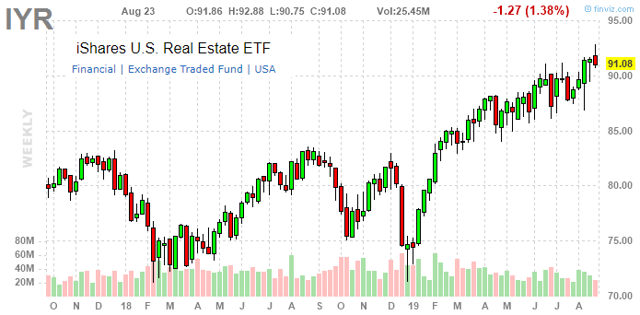
iShares U.S. Real Estate ETF (NYSE:IYR) is one of the largest domestic real estate and REIT-focused exchange traded funds with total assets under management of $4.5 billion. REITs have been exceptionally strong in 2019 with IYR up 23% year to date on a total return basis compared to 15% for the S&P 500 (SPY). That outperformance is in part based on a market trend favoring dividend-paying stocks with a perception of safe payouts, considering emerging concerns over the strength of the economy. There is an understanding that REITs should be more resilient in a potential cyclical downturn.
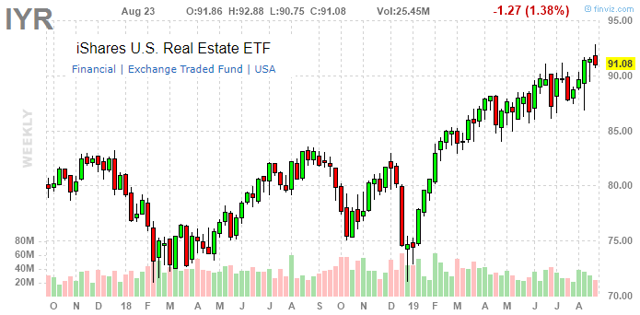
(Source: FinViz.com)
Separately, “tech-REITs” including firms that own and lease cell towers along with some data center names have been among the biggest winners in IYR this year, boosting the entire fund. This article highlights some of the trends in IYR, including the performance and valuation metrics for the underlying holdings along with our view on where the fund is headed next.
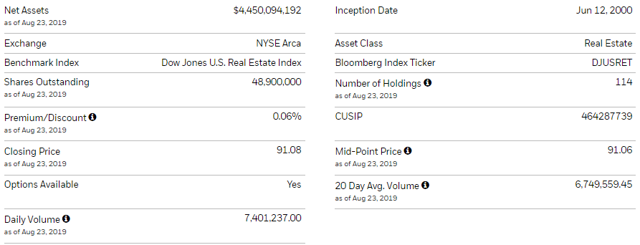
IYR Key Stats. source: iShares
IYR Underlying Performance
The table below includes selected metrics for the top 50 holdings of IYR. As mentioned, IYR is up 23% year to date while the average stock among 114 holdings in the entire fund is up 17%. Only 20 stocks have presented a negative return this year. The fund’s performance has benefited from the relative strength of its top holdings.
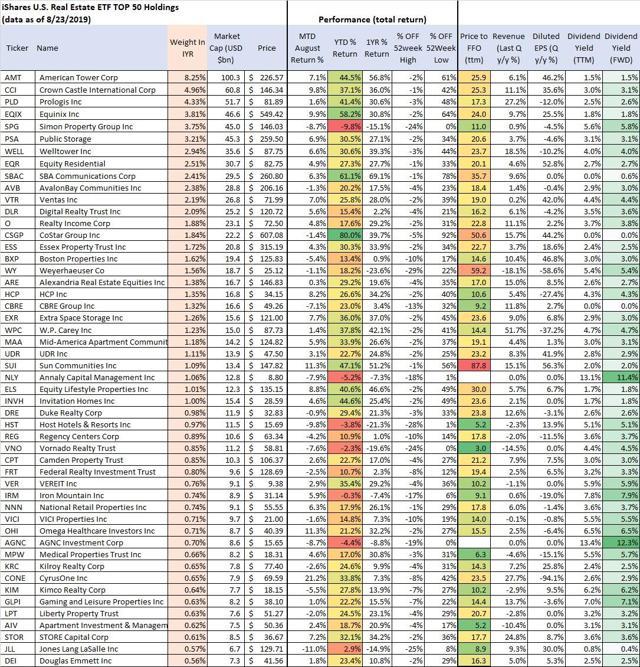
IYR Top 50 Holdings Performance. Source: data by YCharts/ table author
CoStar Group, Inc. (CSGP), a provider of real estate listings and analytics information through a portfolio of brands including Apartments.com, is the biggest winner, up 80% in 2019. The company last reported revenue growth of 16% in the last quarter while the full year EPS consensus estimate is 23% higher from 2018. CSGP is classified as real estate services and not structured as a REIT. While most stocks in IYR are REITs, CSGP along with a couple others including the Howard Hughes Corp. (HHC) with a 0.42% weighting in IYR, for example, are included in IYR as simply being real estate-focused service businesses.
At the other end, Realogy Holdings Corp (RLGY), which operates a residential brokerage business along with other real estate services, is the biggest loser down 56% in 2019. RLGY has reported a decline in unit home sales this year and is free cash flow negative. The company is looking at some cost-cutting initiatives but overall there’s no turnaround in sight.
|
Top 5 Biggest Winners |
Weight in IYR |
YTD Return |
FWD Div Yield |
|
CoStar Group, Inc. |
1.84% |
80.00% |
– |
|
SBA Communications Corp (SBAC) |
2.41% |
61.10% |
0.60% |
|
Equinix, Inc. (EQIX) |
3.81% |
58.20% |
1.80% |
|
Outfront Media Inc (OUT) |
0.32% |
55.40% |
5.30% |
|
Sun Communities, Inc. (SUI) |
1.09% |
47.10% |
2.00% |
|
Bottom 5 Losers |
|||
|
Realogy Holdings Corp. (RLGY) |
0.06% |
-56.0% |
5.80% |
|
Uniti Group Inc. (UNIT) |
0.12% |
-49.70% |
2.60% |
|
Macerich Co. (MAC) |
0.25% |
-31.60% |
10.80% |
|
Tanger Factory Outlet Centers (SKT) |
0.11% |
-26.00% |
10.00% |
|
Senior Housing Properties Trust (SNH) |
0.17% |
-24.00% |
7.20% |
We note that the top 4 holdings by weighting have been big winners which has really driven the return of the ETF. American Tower Corp.(AMT), Crown Castle International Corp. (CCI), Prologis (PLD), and Equinix Inc. together represent 21.4% of the fund and are up 44.5%, 37.1%, 41.4% and 58.2%, respectively, year to date on a total return basis.
AMT and CCI both own, operate, and lease shared telecommunications infrastructure like cell phone towers, while EQIX is a provider of data center services highlighting businesses that are not typically associated with traditional real estate. This is important since a number of companies structured as a REIT could also be considered part of the tech or the communications sector. These companies technically meet the regulatory requirements to be classified as a REIT, like distributing 90% of taxable income and deriving 75% of revenue from real estate sources, but an argument can be made that their stock price performance is more of a function of trends from the telecommunications or technology sector. The point is that AMT, CCI, EQIX along with other smaller “tech REITs” have been big winners recently, presenting faster growth than the overall sector. SBA Communications Corp., IYR’s ninth-largest holding with a 2.4% weighting, is another “cell tower” company and one of the best-performing stocks in the fund this year up 61.1%.
Clearly, current shareholders won’t be complaining given the performance but the exposure to these companies is a criticism of IYR as some investors may prefer to avoid exposure to potentially more volatile business models outside traditional real estate. Consider the Schwab U.S. REIT ETF (SCHH) and the SPDR Dow Jones REIT ETF (NYSE:RWR) as two alternative REIT ETFs that specifically exclude such examples, and may serve its function better as a portfolio diversifier away from telecom and tech. What worked over the past year may not work going forward and this represents higher risk considering these companies have a tilt toward the growth equity-factor exposure that would be more pressured during a market downturn.
The other noteworthy trend is the significant underperformance of some retail REITs, particularly those with exposure to malls and shopping centers. Simon Property Group, Inc. (SPG) down 9.8%, Macerich Co. (MAC) down 31.6%, Taubman Centers, Inc. (TCO) down 13.6%, and Tanger Factory Outlet Centers Inc. (NYSE:SKT) down 20% year to date on a total return basis highlighting this point. While there are some company-specific issues here, in general these REITs face the prospect of fundamental weakness among core tenants which have presented declining same-store sales and lower traffic. SPG’s flagship tenant The Gap, Inc. (GPS), for example, just reported Q2 earnings with comparable-store sales down 4% year over year. While the broader apparel retailer names have faced similar trends, the REITs in this segment face the prospect of store closures and the potential that these tenants won’t renew leases or look to expand with new locations. SKT, which operates some less than prime property assets, has also dealt with tenant bankruptcies in recent years.
While there isn’t necessarily a direct relationship between the tenant’s operating outlook and the REIT’s price performance, the current sentiment in the case of retail doesn’t help. That’s a dynamic we see as playing across other sub-industries should economic conditions deteriorate. From the other REIT sub-industries like industrial and office, these REITs may be pressured if the operating outlook for their core tenants weakens. The first sign would be a market move lower anticipating a cyclical downturn. The S&P 500 is just 5% from its all-time high, and a deeper pullback from here would imply an expectation of weakness in economic growth fundamentals that would pressure all industries. If the tenants have lower growth expectations, the respective REITs should also face pressure as their tenant’s demand for commercial real estate would also cool. This is our base case representing a bearish view on IYR.
Valuation Metrics
Taking the same list from above but presenting valuation metrics, we point out the price to funds from operations “Price to FFO” by the underlying holdings as a comparable metric across IYR holdings. Keep in mind these are the gross figures over the trailing twelve months taken directly from the YCharts financial metrics database. Companies often times present adjusted figures to exclude non-recurring charges which may or may not be more relevant.
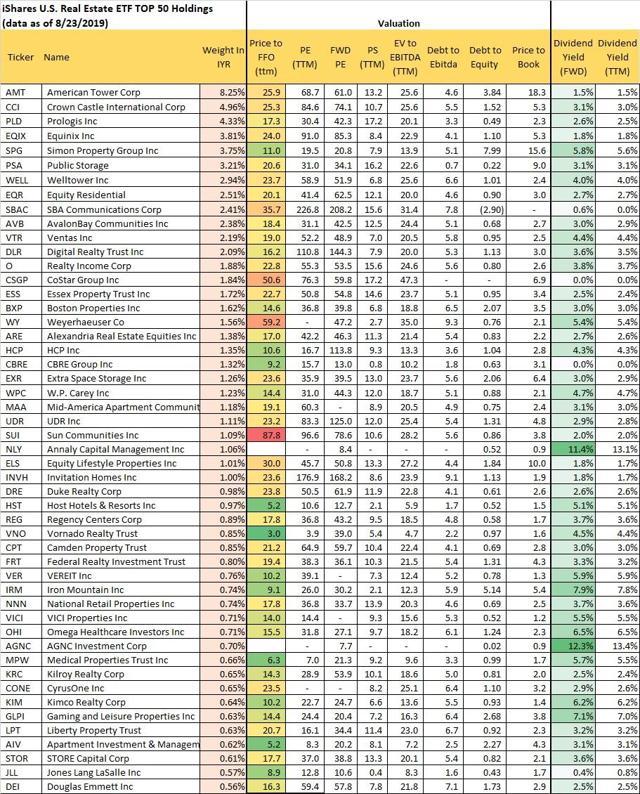
IYR Top 50 holdings performance. Source: data by YCharts/table by author
Across the entire fund with 114 underlying holdings, we calculate a weighted average Price to FFO of 19.8x over the trailing twelve months, and a weighted average debt to EBITDA level of 4.6x. Considering other weighted average multiples including the price to forward earnings ratio at 45x and price to sales ratio at 9.3x, along with the fund’s dividend yield for the fund 2.8%, our conclusion is that IYR is expensive. Much of this is stretched by the characteristics of the top holdings, particularly AMT, CCI, and EQIX.
As mentioned, the non-traditional “tech-REITs” have gained an ever-important role in the REIT universe and IYR. While these companies are benefiting from real fundamental growth drivers, we argue that current valuations are exuberant and consider aggressive forward expectations. These REITs for all intents and purposes are “growth stocks.” This poses higher risk and added volatility for the fund going forward should those forecasts need to be reassessed lower. IYR has become tilted towards these new breed of REITs and in the process, the passive nature of this REIT ETF has likely lifted all boats beyond their fair value in our opinion. We note the current dividend yield at a relatively low level historically in support of our thesis.
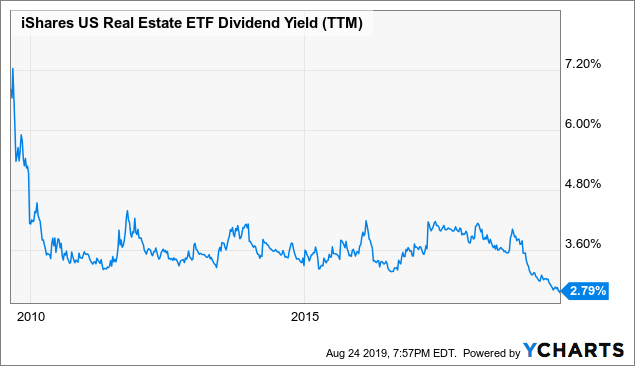
The current dividend yield of IYR at 2.8% on a trailing twelve months basis is now at the lowest level going back to 2008. Based on the chart below, the yield has essentially broken down from a long-held trading range between about 4.25% and 3.25% since 2010, suggesting IYR is now more expensive than it’s been all decade. We consider this to be a sell signal in our view.
 Data by YCharts
Trend Lower in Interest Rates
Economists often times use the Latin term ceteris paribus meaning “all else equal” when describing financial models in an attempt to isolate certain factors recognizing that in the real-world, the reality is that there are too many variables that may influence or change the outcome of any particular condition. As it relates to IYR, it’s safe to say that lower interest rates are generally a good thing; ceteris paribus. REITs which often times have high levels of financial leverage are able to borrow at lower rates and can benefit from a wider income spread. The actual relationship however is more complex, with some evidence that REITs actually benefit more from rising rates historically if they have been based on improving economic fundamentals.
 Data by YCharts
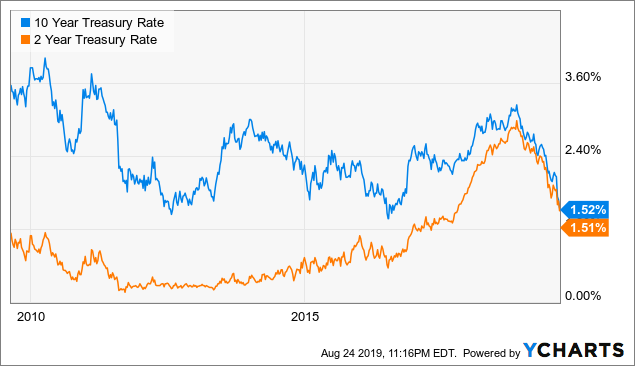
The situation today is one of falling rates and a potential inflection point for the economy. Near term and long rates have fallen precipitously in recent months with the 10-year treasury rate approaching the lowest level since 2016 and about matching the 2-year treasury rate at 1.5%. This near inversion dynamic has many explanations, but one suggestion is that the market sees weak economic growth and subsequently low inflationary pressures out through the next decade. For REIT investors, the setup would limit the ability for companies to raise rents (low inflation) and find new growth opportunities (from a weaker economy). Investors here are forced to make a decision on whether or not they believe the signals implied in the yield curve, and if the benefit from lower rates now is worth what we see as higher risks.
Here are two scenarios that could play out and both would be bearish for IYR in our opinion.
1) The yield curve signal is correct and foreshadows at least a gradual slowdown of the economy. Clearly, bearish for IYR as the operating and earnings outlook would deteriorate with current consensus estimates for underlying holdings requiring revisions lower.
2) The yield curve is just plain wrong and policymakers including the Fed will be able to not only avert a slowdown, but the latest rate cut could lead to a renaissance of economic growth expectations and positive sentiment towards risks sentiment. A catalyst here could be a quick and favorable resolution to the U.S.-China trade dispute, although not our base case.
In this scenario, it is possible a rotation out of “defensive” sectors takes place with the market again favoring more cyclical sectors over REITs. Separately, higher growth expectations would lead to renewed inflation pressure and could drive a move higher in rates, which would reverse the current trend that is seen as positive for REITs. This scenario could be bearish for IYR as the market would again favor more cyclical names and the current premium implied in REITs would be pared back.
Our base case without having to bet on either of the scenarios above is to expect higher volatility among interest rates and economic growth expectations which would also be bearish for the sector. We are bearish on IYR based on these dynamics and our valuation concerns.
Takeaway
IYR has been a big winner over the past year with its underlying holdings benefiting from a unique combination of thus far resilient economic growth, better than expected earnings, dovish Fed policy, and a move in the market favoring defensive type dividend stocks. We think there are some good reasons to turn more cautious on IYR at the current level and it could be a good time to at least reduce exposure as valuation appears stretched. We rate IYR as a Sell based on our more bearish opinion of the broader market and see IYR as a fund that would face a resetting of expectations lower representing downside. Please read the fund’s prospectus for a full list of risks and disclosures.
Disclosure: I/we have no positions in any stocks mentioned, and no plans to initiate any positions within the next 72 hours. I wrote this article myself, and it expresses my own opinions. I am not receiving compensation for it (other than from Seeking Alpha). I have no business relationship with any company whose stock is mentioned in this article.
Additional disclosure: The information contained herein is for informational purposes only. Nothing in this article should be taken as a solicitation to purchase or sell securities. Investing includes risks, including loss of principal.
[ad_2]
Source link Google News

