[ad_1]
ArtistGNDphotography/E+ via Getty Images
iShares U.S. Energy ETF (NYSEARCA:IYE) is an exchange-traded fund that seeks to track the performance of its chosen benchmark index, the Russell 1000 Energy RIC 22.5/45 Capped Gross Index. IYE has a reported expense ratio of 0.41%.
The fund had 37 holdings as of May 31, 2022. The benchmark index does not offer very informative information as to the portfolio’s underlying profitability and productivity. Nevertheless, IYE is basically a large-cap energy stock portfolio. The fund’s index’s “constituents are capped quarterly so that no more than 22.5% of the index weight may be allocated to a single constituent and the sum of the weights of all constituents representing more than 4.5% of the index should not exceed 45% of the total index weight.”
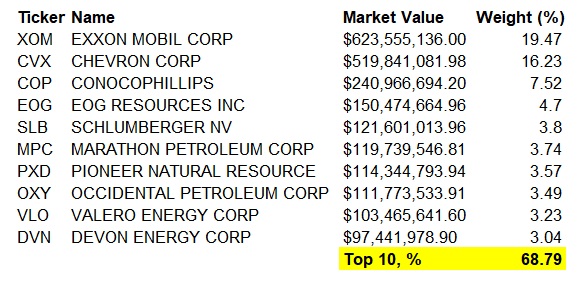
But as there are only 37 holdings, even with the capping methodology, IYE is still concentrated in just a handful of single names. The top 10 positions represented 68.79% of the portfolio as of May 31, 2022.
Data from iShares.com
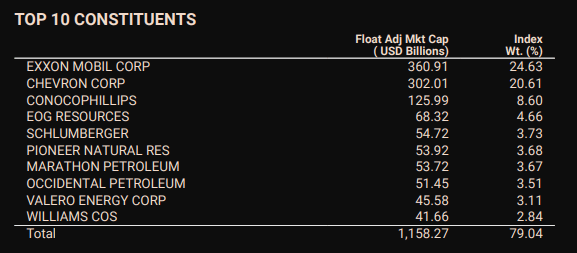
The portfolio is quite similar to MSCI’s USA Energy Index:
MSCI.com
The USA Energy Index is more concentrated with only 20 names in total (as opposed to IYE’s 37 holdings), but the top names include almost all the same names but one. The USA Energy Index’s trailing price/earnings, forward price/earnings, and price/book ratios were 20.27x, 11.12x, and 2.48x, respectively, with a trailing dividend yield of 3.27%. Meanwhile, IYE’s same ratios per data from Fidelity (for the trailing data) and Morningstar (for the forward price/earnings ratio) were 19.70x, 9.64x, 2.51x, respectively, with a trailing dividend yield of 2.77%. I will use this data to gauge IYE as a starting point.
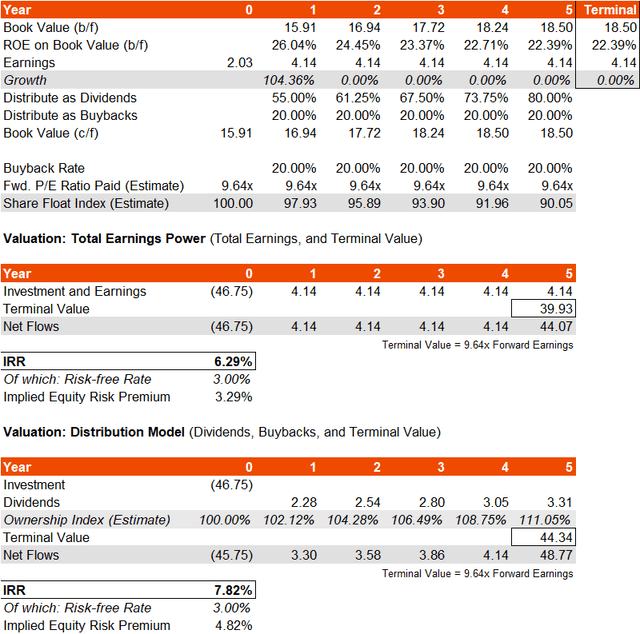
The data above implies a forward ROE of 26.04%. Morningstar’s data also suggests three- to five-year average earnings growth in the range of 25.92%, which seems high. If we include the forward one-year jump in earnings implied by my trailing and forward price/earnings ratios, you could assume zero earnings growth thereafter and still get to a three- to five-year earnings growth range of around 15.37-26.90%. I will assume this for now, and also assume that dividend distributions pick up from around 55% to begin with, all the way to 80% by year five.
Plenty of oil companies also have buyback programs, and given the industry I would probably assume that these will remain high, but I will just assume a 20% buyback rate for now, and we can adjust between 0 and 50% later for some variation. I will also assume the forward price/earnings ratio remains the same over time at 9.64x, which is admittedly low; even with a terminal growth rate of 0%, that’s a forward earnings yield of 10.37%. With a risk-free rate of 3%, that’s an equity risk premium of over 7%.
Nevertheless, based on the prescriptive inputs above, my implied IRR arrives at between 6.29% and 7.82%, depending on whether one values IYE on its total earnings power or dividends, buybacks, and terminal value only.
Author’s Calculations
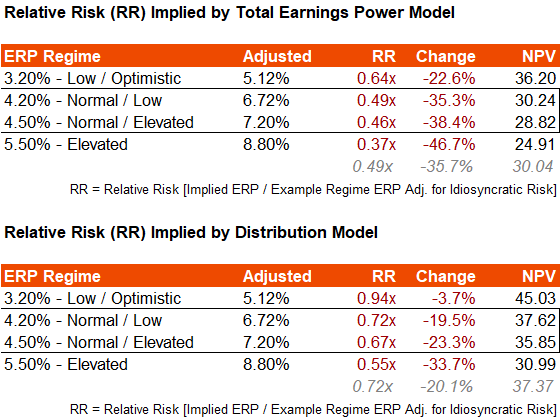
Because of the volatility associated with energy company profits, I am not comfortable with increasing earnings growth beyond year two, even from 0%, given the forecasted bump in earnings over the first year. If I change the buyback rate to either 0% or 50%, with no buybacks the valuations do not change too much; with a 50% buyback rate, the IRR could be as much as 10-11% in the distribution model. Yet in my base model, with an IRR of say, 6.29-7.82% (as pictured above), IYE is most likely overvalued. That is because not only is the IRR range tight, leaving very little in the way of an implied equity risk premium, but IYE itself is fairly high beta (1.60x on a five-year basis).
Author’s Calculations
So, at current prices, without assuming either surprisingly strong earnings growth beyond consensus estimates, and/or a strong expansion of the IYE earnings multiple, I would think that the fund is likely positioned for under-performance from present prices. Even in an optimistic scenario, it is possible that the fund is either trading at fair value, or could face further downside of over 20%. As we head into the later stages of the business cycle, perhaps this bearish take is also cyclically propitious.
[ad_2]
Source links Google News

