")
[ad_1]
syahrir maulana/iStock via Getty Images
Investment Thesis
Over the last five years, the iShares Russell Top 200 Growth ETF (IWY) has been the best-performing large-cap growth ETF. Its focus on only the largest U.S. growth stocks, effectively weeding out less profitable and more speculative companies, has proven to be a winning strategy, gaining a massive 163.47% from March 2017 through February 2022. That’s 14% more than the largest ETF in the category, the iShares Russell 1000 Growth ETF (IWF). But with runaway inflation, the likelihood of several interest rate hikes this year, and now Russia’s invasion of Ukraine, growth ETFs across the board are sinking. IWY lost 10.16% from November to February, which still beat out nearly every category peer.
The purpose of this article today isn’t to prove IWY is a leading large-cap growth ETF. Instead, I’m going to search for signs that its valuation is attractive again by comparing its fundamentals with the Vanguard Value ETF (VTV), the SPDR S&P 500 ETF (SPY), and IWF, the three largest ETFs in the large-cap value blend, and growth categories. In the end, I think you’ll agree that it’s best to avoid adding to growth ETFs at the moment, but if they fall further, IWY should be high on your list to buy.
ETF Overview
Strategy, Sector Exposures, and Top Holdings
IWY tracks the Russell Top 200 Growth Index, using just three factors to differentiate growth from value:
- Three-year net change in earnings per share (excluding extraordinary items) over current price
- Three-year sales per share growth rate
- Momentum (one-year price change)
The Growth Index doesn’t hold 200 stocks; it merely selects from a universe of the 200 largest U.S. stocks by market capitalization. IWY has 109 holdings plus 0.24% in cash and equivalents, and as shown below, nearly half is in the Technology sector.
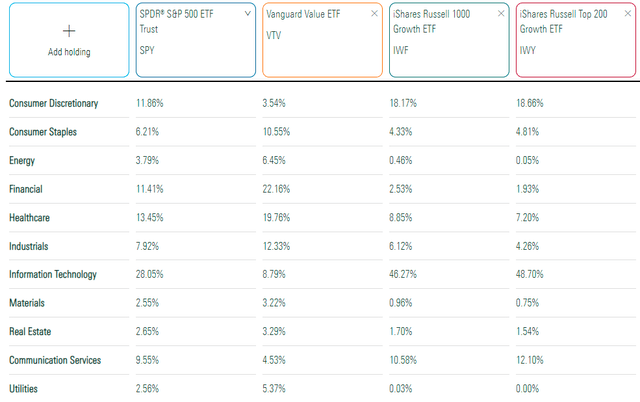
Morningstar
You’ll notice that IWY is simply a more amplified version of IWF. It has a little more exposure to the most prominent sectors (Technology, Consumer Discretionary, Communication Services) and less exposure to the smallest sectors (Energy, Financials, Real Estate). However, as you move toward the blended and value ETFs (SPY and VTV), exposure to more defensive sectors like Financials, Health Care, and Consumer Staples increases. In exchange, Technology and Consumer Discretionary exposure is reduced.
As for IWY’s top ten holdings, they total 57.74% of the ETF. Such concentration is a concern, but less so when considering how profitable these companies are. While that alone does not justify their lofty valuations, it suggests they’re better equipped to ride out any recession that may be on the horizon. I like most of these companies as long-term holds, assuming you have a long enough time horizon.
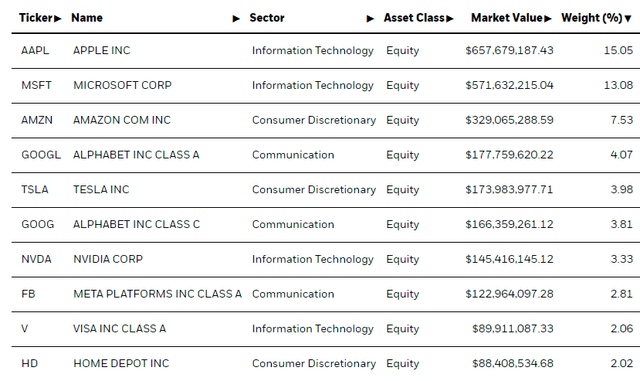
iShares
Historical Performance
The graph below highlights the market’s penchant for growth stocks since the Great Financial Crisis. IWY launched on September 22, 2009, so its share price has generally risen uninterruptedly. There have only been five double-digit drawdowns (using month-end values as reference points), and the most prolonged underwater period was just four months in 2010, 2011, and 2018. It was performed the best during the Q1 2020 pandemic crash, falling 15.69% but recovering in two months.
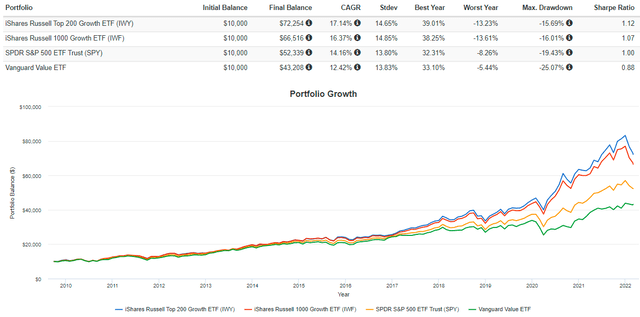
Portfolio Visualizer
Of course, I don’t mean to suggest things will always be so rosy. Since IWY and IWF are similar ETFs, we can use IWF as a proxy and go back as far as June 2000 to September 2009, when IWY launched.
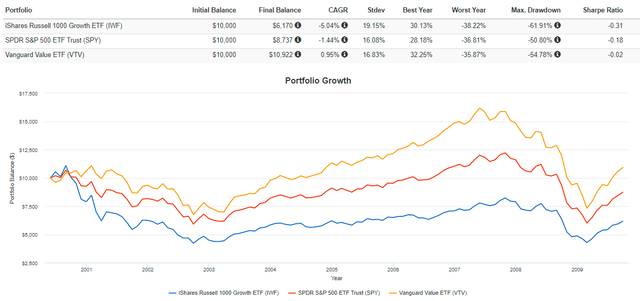
Portfolio Visualizer
Here, we see the opposite, with VTV being the best performer. The reason is the dot com bubble and the Great Financial Crisis when high growth stocks slumped. I don’t think we’re in danger of the dot com bubble repeating because of how profitable today’s Technology companies are. However, high energy prices preceded the Great Financial Crisis, so investing in many high-growth stocks isn’t a wise move, in my view.
Fundamental Analysis
So far, I’ve shown the substantial differences among the U.S. market’s growth, blend, and value segments on sector exposures and historical performances. Next, I want to highlight the differences on a fundamental level because I think it will help paint a picture of what the market is favoring at the moment. The table below shows selected metrics for IWY’s top 20 holdings, such as volatility levels, revenue and EPS growth rates, and price-earnings ratios. Summary metrics are also provided for IWF, SPY, and VTV.
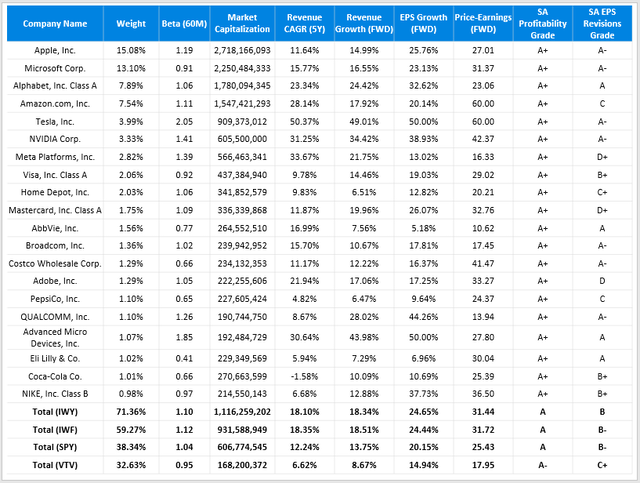
Author Using Data From Seeking Alpha
IWY vs. IWF
I mentioned earlier how IWY was just a more amplified version of IWF, but I think its higher concentration level is worth it. IWY is slightly less volatile based on its five-year betas (1.10 vs. 1.12) and has a slight advantage on forward EPS growth (24.65% vs. 24.44%) and forward price-earnings (31.44 vs. 31.72). In addition, the better EPS Revisions Grade (B vs. B-) is important to me. This metric, which I’ve calculated using individual component grades for both ETFs, indicates that analysts are a bit more optimistic on the largest growth stocks than the smaller, perhaps more speculative, stocks included in IWF.
IWY vs. SPY
When compared with SPY, IWY’s concentration begins to be more of a problem since it’s nearly double among its top 20 holdings. Weighted-average market capitalization is almost cut in half from $1.12 billion to $607 million, but the five-year beta lowered to 1.04. These differences are expected as we add more value stocks to the mix.
Despite the poor recent performance of growth ETFs, IWY’s forward price-earnings ratio remains elevated at 31.44, but it still has a high amount of expected EPS growth (24.65%) on offer. On the other hand, SPY’s P/E ratio is six points lower, and the EPS growth difference is only 4.50% less. If you’d like, you can calculate a rough price-earnings-to-growth (PEG) ratio with these figures, with lower values being more attractive. IWY’s would be 1.28 (31.44 / 24.65), while SPY’s is 1.26 (25.43 / 20.15). Therefore, IWY is still trading at a slight premium based on the PEG ratio, but you have to consider the possibility of these high growth targets not being met at all. With a consensus 150 basis point increase in interest rates this year, IWY seems far too risky.
IWY vs. VTV
Naturally, the most considerable differences are found when comparing the growth and value ETFs. VTV offers a much lower 0.95 five-year beta but makes major revenue and EPS growth sacrifices. However, its forward P/E is attractive at 17.95, and the estimated PEG ratio is about 1.20, making it the cheapest of the three. The declining Profitability and EPS Revisions Grades are concerning, though, so I caution value investors not to get too comfortable. Neither ETF has much exposure to Energy stocks, so they’re all at risk should the economy worsen.
Investment Recommendation
I think IWY is one of the better growth ETFs available. It’s not the cheapest, but it’s full of the highest-quality and most profitable U.S. stocks. This feature makes it likely IWY will rebound strongly after any market downturn, similar to how it handled the COVID-19 pandemic in Q1 2020.
IWY’s main issues are its elevated forward price-earnings ratio of 31.44 and the fact that steep energy costs and rising inflation often precede recessions. In addition, rising interest rates suggest it will be harder for high-growth stocks to hit their earnings targets each quarter. Those are the fears I have today, so while I think it’s an excellent ETF to own for long-term investors, I suggest investors wait for another significant price drop before taking a position. I’m limiting my rating on IWY to hold, and I look forward to providing another update after the next earnings season.
[ad_2]
Source links Google News