[ad_1]

syahrir maulana
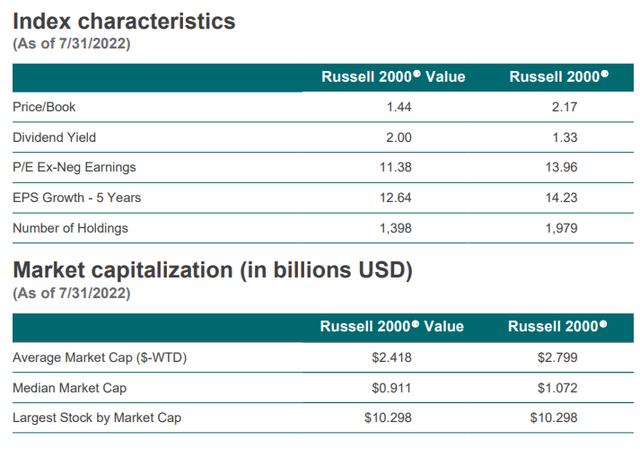
iShares Russell 2000 Value ETF (NYSEARCA:IWN) is an exchange-traded fund whose benchmark index, the Russell 2000 Value Index, measures the performance of small-cap value stocks in the U.S. equity market. IWN essentially buys stocks in the Russell 2000 that are trading at relatively low price/book ratios, lower two-year earnings growth forecasts, and lower five-year historical sales growth rates. Some details are provided below, including a price/earnings ratio of 11.38x, although this crucially excludes negative earnings.

FTSERussell.com
A lot of smaller companies are loss making, so adjusted earnings are not particularly useful for valuation purposes. In fact, the picture is quite murky in general for this reason. An alternative data source, Morningstar, also seems to use an adjusted figure, given that their forward price/earnings ratio is similarly low, at just 10.52x. That would suggest, on their price/book ratio of 1.19x, a return on equity of about 11.3%, but that would be across the portfolio. This is going to be inaccurate. For example, at the start of the year, an article in the Wall Street Journal reported that a third of the companies in the Russell 2000 (broader index) are loss making. I would imagine a greater portion of the Value segment is loss making, given the basic selection criteria.
So, it is not a particularly good idea to attempt to value IWN in a conventional way. I have checked numerous sources, and the vast majority seem to adjust for negative earnings. Having said that, WSJ has a live estimate of an average price/earnings ratio for IWN’s portfolio of 18.88x, with an average price/book ratio of 1.76x. This is a decent start. Earnings growth estimates in aggregate by analysts (in consensus) can often be exaggerated; still, Morningstar reports a three- to five-year earnings growth potential of almost 17% per year for IWN. This seems to contradict the selection criteria of the fund though. Nevertheless, WSJ’s ratios would imply a return on equity in the region of 9.3%. That is not too bad, and can help us form a basic idea of what IWN’s shares are worth.
At the moment, equity risk premiums are elevated as perceived macroeconomic uncertainty is high. Professor Damodaran estimates that the U.S. ERP is 5.10% as of September 1, 2022. The current U.S. 10-year yield, a popular measure of the appropriate risk-free rate, is 3.25% at the time of writing. IWN’s historical beta, per iShares themselves, is 1.19x. Applying a multiple of 1.19x against the ERP of 5.10% gives us an adjusted ERP of 6.07%. Adding in our risk-free rate of 3.25% gives us 9.32%. Let’s assume value stocks are low-growth in the long run, and rise in line with a lower nominal level of inflation of circa 2%. That gives us a net-of-growth discount rate of 7.32%. Divide 1 over 7.32%, and we fetch a multiple of 13.66x.
This basic analysis would imply that IWN is on the pricier side. Yet on the other hand, IWN’s portfolio (which by the way had 1,398 holdings as of August 31, 2022, which likely explains why the level of beta is quite low) does offer some upside potential. That is because the loss-making companies can become profitable, and/or they trade on other measures beyond conventional earnings measures (perhaps on cash flow, or dividend yields). The current dividend yield per iShares for IWN is 1.95% on a 30-day SEC yield basis. That is not too bad, although it is below the U.S. 10-year yield, so I would not suggest there is a floor to the price of IWN shares on that basis.
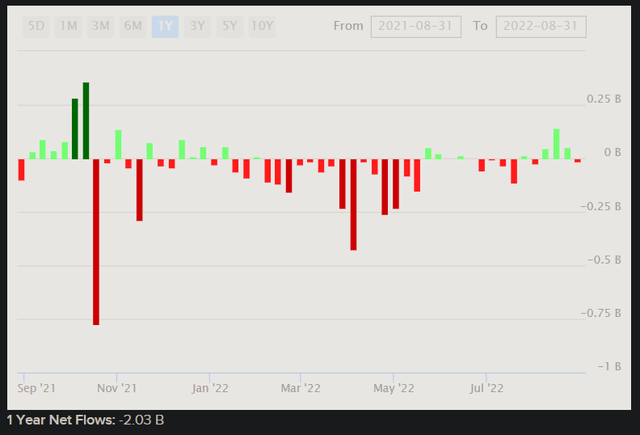
IWN had $12.1 billion in assets under management as of August 31, 2022, and that is in spite of net outflows of circa $2 billion over the past twelve months or so.

ETFDB.com
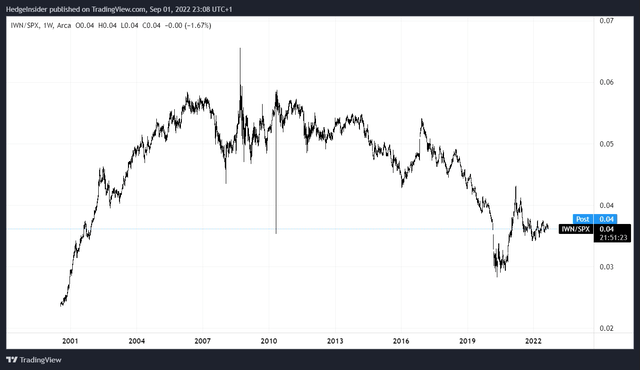
Risk is not favorable at the moment, but IWN has been suffering from outflows for at least a year on a net basis. The chart below shows the price of IWN in terms of the S&P 500 U.S. equity index. IWN can apparently outperform the S&P 500 earlier on in the business cycle (e.g., from 2001, also from early 2008, and later from 2015/16, and from 2020 following the emergence of COVID-19 that caused chaos across the global economy and markets).

TradingView.com
However, following a jump (early in the business cycle), IWN’s capacity to outperform is weaker. Further, since 2009/10, the long-term trend has been negative, while high-performing mega-cap tech stocks have taken up a much greater proportion of the major U.S. equity indices (including the S&P 500). Risk capital tends to get pushed into these large, liquid stocks with high returns on equity, not so much riskier, small-cap stocks or emerging markets.
Before the “tech regime” we have been in for over 10 years now, the so-called “small-cap premium” has become less exciting; the idea that small caps trade at elevated risk premiums, and thus one can earn outsized returns if one is able to withstand the volatility. Emerging markets also used to be in vogue among pro-risk investors, but tech stocks have ultimately come out on top; most specifically U.S.-based technology companies.
I think given the riskier nature of IWN’s portfolio, it is likely that long-term returns will be reasonably good. But I think given the long-term trend whereby IWN is underperforming the S&P 500, the latter being a common benchmark representing essentially 1x beta (what should be less volatile than say, IWN), it does not make much sense to buy IWN over the broader indices. You take on potentially more risk for less return.
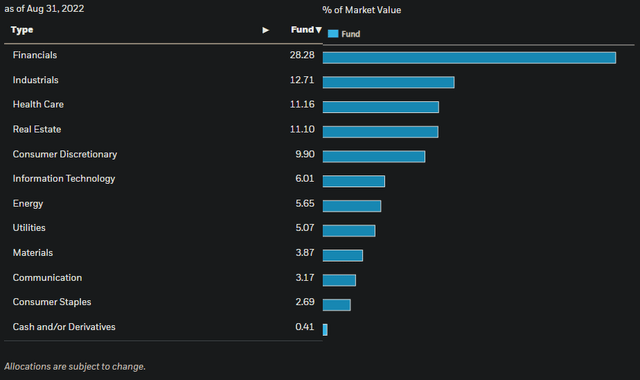
Also, the sector exposures are in fairly conventional, mature, low-growth industries (as you would expect), including Financials (28% of the portfolio as of August 31, 2022), Industrials (13%), Health Care (11%), and Real Estate (11%). Technology only makes up 6% of the portfolio.

iShares.com
IWN is the kind of fund you might expect to do well during times of rising interest rates, like now, since higher discount rates tend to punish higher-growth companies (since a greater proportion of their theoretical lifetime earnings are out in the future). However, as my chart shows, the IWN/SPX ratio has not budged too much since the start of 2021 (most recently), in spite of the U.S. 10-year yield rising during this period from less than 1% to a present 3.25%.
On an adjusted earnings basis (price/earnings circa 10-11x on a forward basis), maybe IWN is “undervalued”, but that would be giving all the loss-making holdings credit for future turnaround potential. Pricing IWN shares by including negative earnings (price/earnings circa 18-19x) is perhaps overly pessimistic, as it assumes no growth or “turnaround” potential, and I think most of the point of investing in IWN is capturing the elevated risk built into the price given those riskier holdings. It’s probable that the underlying forward price/earnings ratio will fall somewhere in between, probably closer to my “fair multiple” calculation of around 13-14x.
Therefore, I would say that in summary, IWN is probably trading at close to fair value, and expected returns on holding IWN over the longer term (several years) might be in the region of 9% per year at present (total return including dividends), simply given elevated equity risk premiums and current risk-free rates. However, this assumes that we are compensated for the level of beta in the fund; if IWN were to resume longer-term underperformance, returns might be in the range of 7-8.5% per annum.
As interest rates are currently rising, and may well turn lower into the next cycle (if or when inflationary pressures subside), and regardless since I imagine these small-cap value stocks have less pricing power during inflationary times, and furthermore given that we are no longer jumping out of the early stage of a business cycle, IWN does not seem best positioned to me. I would not be bearish, but being neutral seems to make sense at this juncture.
[ad_2]
Source links Google News

