[ad_1]
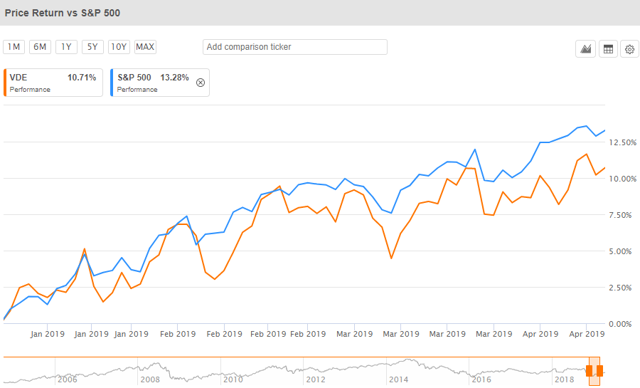
Holders of Vanguard’s Energy ETF (VDE) have had quite a turbulent year as shares have seriously lagged the performance of the S&P 500. On a relative basis, VDE has unperformed the S&P 500 by nearly 12% since oil peaked in the last quarter of 2018.
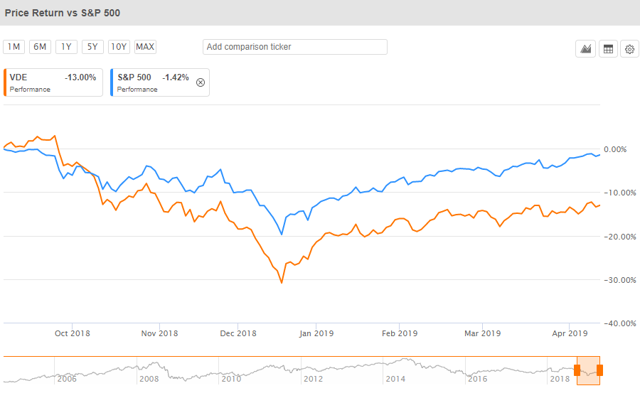
And, despite the rally in crude oil which started in January, VDE has lagged S&P 500 performance by a few percentage points.
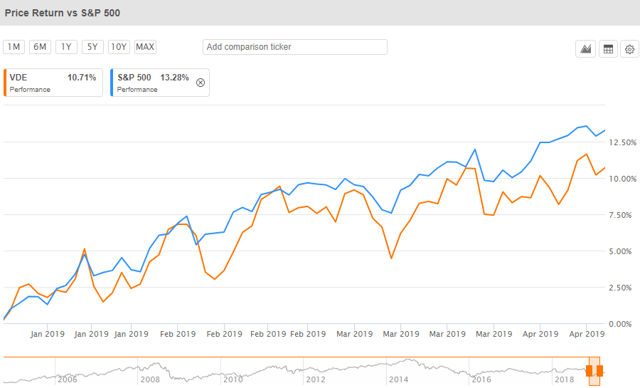
Despite this underperformance, it is my belief that, in the near future, we will see exceptional price appreciation for shares of VDE, benefiting those who are considering purchasing or are currently holding the instrument. But, first, let’s discuss VDE and what’s been leading to this underperformance that we’ve seen.
So, what’s going on here? Why would a rally in the largest energy commodity (WTI futures) not impact the total holdings of VDE and result in outstanding performance versus the S&P 500? To answer this question, we need to dive into the holdings and then examine the lines of businesses in which these holdings transact.
A simple analysis of the holdings of VDE will reveal that while it covers a variety of energy stocks, several of the top 10 holdings are spread out across a few different industries and derive revenues from different sources. Indeed, if you dive into its methodology, you’ll find that VDE tracks the MSCI US Investable Market Index (IMI)/Energy 25/50 Index which basically forces a broad diversification by preventing more than 25% of assets from being concentrated in a single security and investing across the three main market capitalization buckets. In other words, if you buy VDE, you’re buying a pretty broad exposure of everything related to energy.
In the MSCI Energy 25/50 Index methodology, we find this chart which will be very relevant for our analysis.
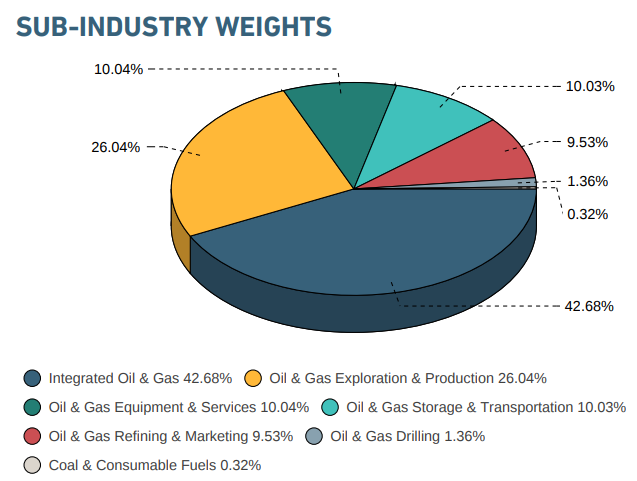
To generate an investment thesis on an ETF, we’ve got to understand what an ETF holds and the fundamentals impacting these industries. We can take some broad strokes using the above chart and come to some basic conclusions about where to direct our analysis.
First, about 77% of holdings represent oil and gas production and refining (a number which includes integrated companies as well). The next 20% is divided among equipment services and storage and transportation – industries which are dependent upon the activities of the main chunk represented by this ETF. In other words, if we can understand the economics and fundamentals impacting the exploration and production industries, then we’ll largely understand what’s happening in this ETF.
In recent pieces, I have made the case that the energy fundamentals are now bullish across most of the industry. While this analysis was directed at the energy industry at large and is therefore certainly applicable to VDE as well, in this piece, I want to hone in on a few key additional elements which directly impact the holdings of VDE.
Crude
The first key element to examine when it comes to the energy market is the stock level of crude oil. The major commodity and revenue source of most of the holdings in VDE is directly exposed to the outright price of crude oil and the various grades of crude oil are all highly correlated with WTI.
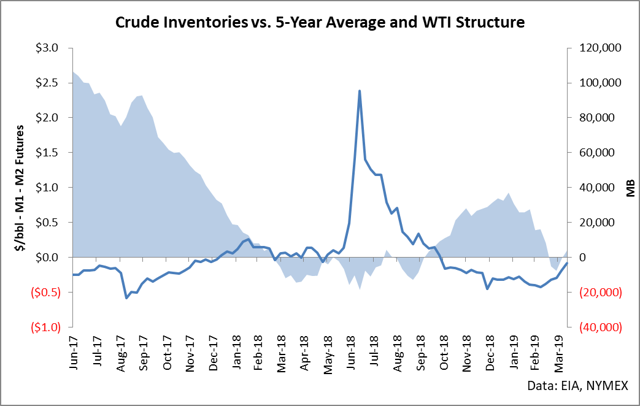
The WTI market is seeing an interesting switch occurring in the most recent data from the EIA in which crude inventories (shaded area) have fallen beneath its seasonally-adjusted 5-year average and are flirting with that level. In situations like this, it indicates that the market is undersupplied, and structure generally begins to trend towards backwardation as seen in the line-chart above. Backwardation is a state where front futures contracts trade above further contracts out on the curve and indicates that the market has greater immediate demand for crude versus demand in later months.
When the market is in backwardation, flat price crude is generally bullish, as seen in the following chart.
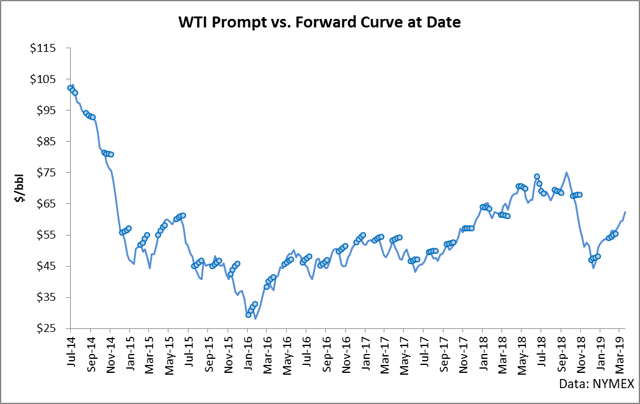
There’s a lot of information contained in this chart, and it’s worthy spending some time to absorb it. There are two elements of this chart. The first is the flat price of crude oil (the line), and the next is the forward curve on the date on which price was reported (dotted lines). This shows what the forward curve looked like every few months as well as the trend in crude pricing.
There is a clear relationship in that while prices are falling, the market generally is in contango (state in which front months are beneath later months). When the market is rising, it is generally in backwardation or very weak contango. For example, the rally from September 2017 through August 2018 witnessed the market switch from contango to backwardation while price continued to rise upwards.
The relevance for VDE holders is this: we have just seen the market switch into backwardation in the most immediate daily price settlements (not shown on the previous chart due to it only showing weekly data). This means that the market is demanding crude oil now versus later months and is generally indicative of bullish market trends in undersupplied markets. In other words, the world is now short of the major commodity (by market cap) which the holdings of VDE are largely directly exposed.
Refining
VDE also is exposed to the refining industry, which even though it is in the energy sector, it is ruled by entirely different economics. For example, refining is largely indifferent to the outright price of crude oil in that its revenues represent the (crack) spread between the price of products and the price of crude oil. Higher crude costs can have cost of capital implications, but beyond that, refiners are simply capturing a spread: buy crude, sell products.
This year, refining has lagged the S&P 500 due to a few different factors. As I’ve previously covered, refining oversupplied the markets and drove crack spreads into the ground, killing the economics of the industry for a few months. Indeed, the 321 cracks of the major regions and NYMEX all traded near multi-year lows for the first quarter of the year as seen in the following charts.
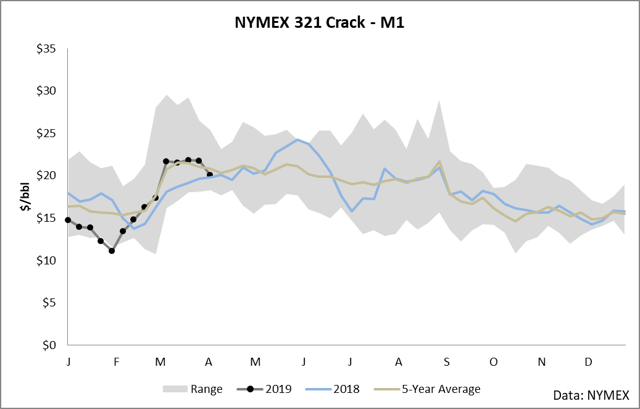
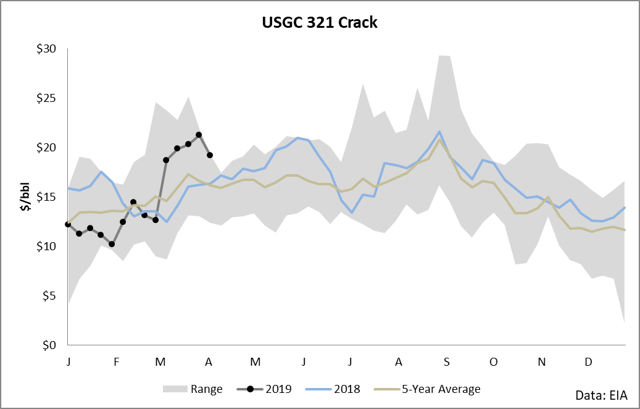
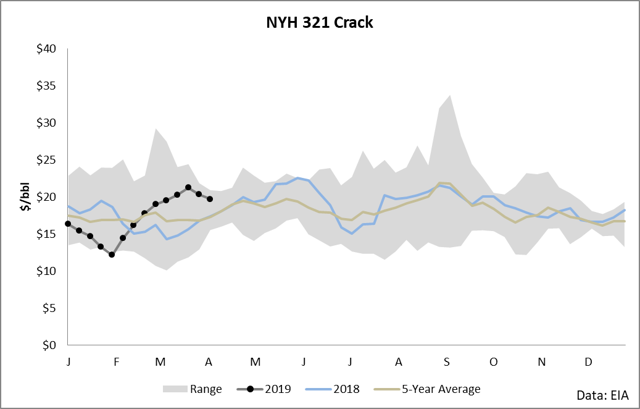
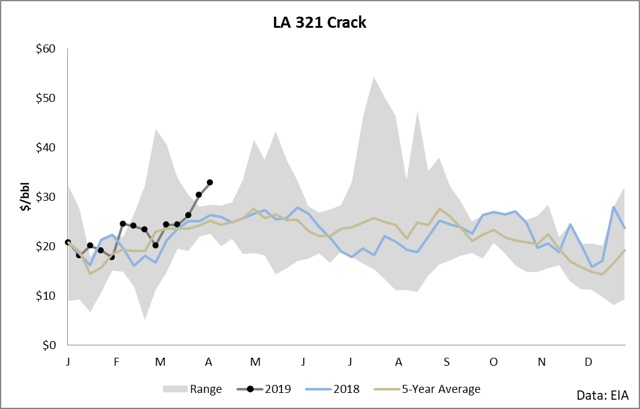
However, economics are now strong for refined products. The U.S. Gulf Coast (USGC) and Los Angeles (LA) are flirting with 5-year seasonal highs while New York Harbor (NYH) is trading just under them. A look at the market structure for gasoline shows the real story for refined product demand.
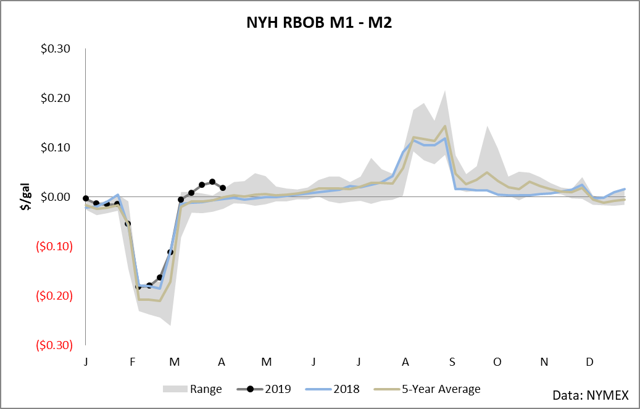
Over the last month, we’ve seen the front-month RBOB contract strengthen substantially versus the next out. The level of backwardation is historic for this time of year and shows the rebounding demand for gasoline. This is very bullish for the refining industry in that gasoline is the meat-and-potatoes for the bulk of the industry, with nearly half of the typical refining offtake being gasoline alone.
Both the exploration and production industries are bullish, and the crude market has just switched into backwardation, indicating immediate demand for production. Refining cracks are incredibly strong, while RBOB is trading at strong backwardation, indicating immediate demand for refined products. Barring any natural disaster, the “buy” case is pretty clear for holders of VDE in that both E&P and refining have just recently entered a golden situation for their industries. The market structure and inventory levels are strongly indicative of some of the highest demand levels seen in several quarters, which means that we are likely to see VDE rally as the E&P, integrated, and pure refining constituents directly benefit. The services companies will respond to the activity in each sector and will see an uptick in business as well. Perhaps, the only companies which will suffer in this immediate shift we see in the energy landscape will be pure storage plays. Storage really requires contango to be in demand in that you want a difference in futures contracts to be greater than your cost of capital over your storage horizon (in other words, strong contango). However, pure storage represents a small fraction of VDE’s holdings and therefore can largely be ignored for this analysis.
In light of the immediate shift in demand for crude and products, it really does make sense to be holding VDE.
Disclosure: I/we have no positions in any stocks mentioned, and no plans to initiate any positions within the next 72 hours. I wrote this article myself, and it expresses my own opinions. I am not receiving compensation for it (other than from Seeking Alpha). I have no business relationship with any company whose stock is mentioned in this article.
[ad_2]
Source link Google News

