[ad_1]

jonathanfilskov-photography/E+ via Getty Images
Investment Thesis
Contrary to popular belief, U.S. utilities aren’t destined to underperform because treasury yields rise. I cautioned as much over two months ago in my bullish piece on the Utilities Select Sector SPDR ETF (XLU). Since then, XLU has outperformed the S&P 500 Index by more than 11%, and the sector was the second-best-performer. Only Energy did better, which is understandable given oil prices today.
The iShares Utilities ETF (NYSEARCA:IDU) is another option investors may be considering, albeit a much more expensive one with a 0.41% expense ratio. However, it’s more diversified than XLU and scores slightly better on growth. This article will discuss these and several other features of each ETF and ultimately decide whether IDU is worth buying.
ETF Overview
Strategy
IDU tracks the performance of the Russell 1000 Utilities RIC 22.5/45 Capped Index. This Index selects Utilities stocks based on Industry Classification Benchmark (“ICB”) framework rather than the Global Industry Standard Classification (“GICS”) system used for XLU. The Index reviews and rebalances quarterly, ensuring companies with weights greater than 4.5% have an aggregate weight less than 45%. In addition, no single constituent can have a weight greater than 22.5%. Investors can expect slightly better diversification for these reasons, but they’ll pay for it. IDU’s expense ratio is 0.41%, which is why it’s been one of the weaker-performing utilities ETFs over the last decade.
Top Holdings
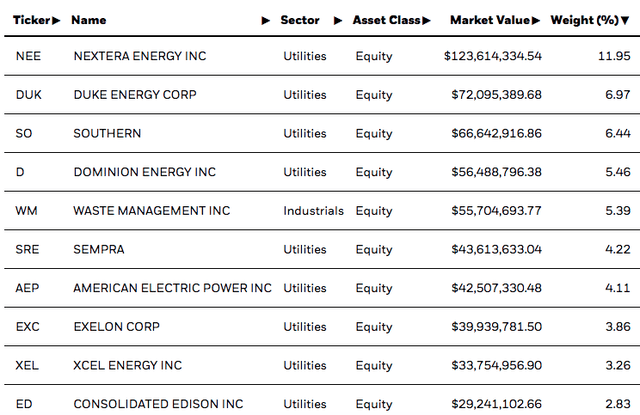
IDU’s top ten holdings are shown below, totaling 54.49%. The ICB framework results in about a 10% allocation to the Industrials sector if investors follow the GICS framework, including Waste Management (WM). NextEra Energy (NEE) is currently the top holding with an 11.95% weight, followed by Duke Energy (DUK) and Southern (SO). There are 44 holdings in total.
iShares
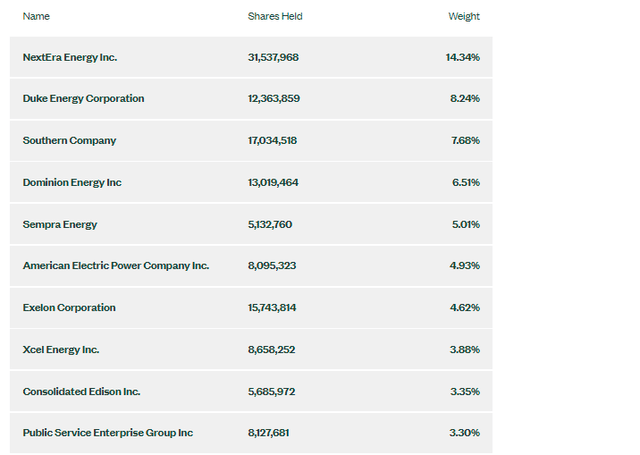
You’ll find that XLU’s top ten holdings are similar, just with lower weightings, highlighting the diversification differences. XLU’s top ten holdings total 61.86%, and the entire ETF has just 29 large-cap stocks.
State Street
Performance
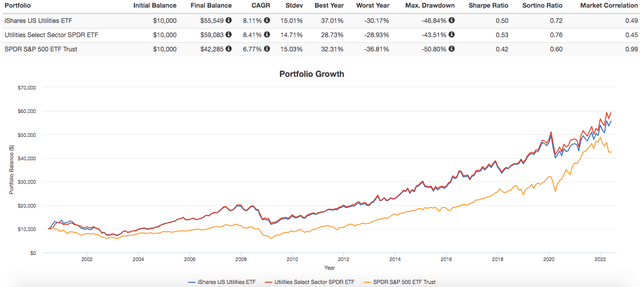
Since IDU’s launch in June 2000, it has gained an annualized 8.11% compared to 8.41% for XLU. Due to slightly higher volatility, its risk-adjusted returns (Sharpe and Sortino Ratios) were slightly worse, but not by much. Even though the annualized return difference was only 0.30%, you can see how much that adds up over the long run. IDU’s total return was 455.49% compared to 490.83% for XLU. Such a long holding period may not apply to you, but minimizing fees is integral to building long-term wealth. Unless there’s a compelling reason, you should try to default to the lowest-cost option.
Portfolio Visualizer
The graph also shows IDU and XLU outperforming the SPDR S&P 500 ETF (SPY) by quite a large margin. However, it’s a bit misleading since IDU launched right around the time of the tech crash in the early 2000s. A look at rolling returns paints a more accurate picture and does a good job highlighting that utility stocks often achieve higher lows but lower highs. This lower volatility, combined with a usually-high dividend yield, makes it an attractive sector for conservative investors.

Portfolio Visualizer
Dividends
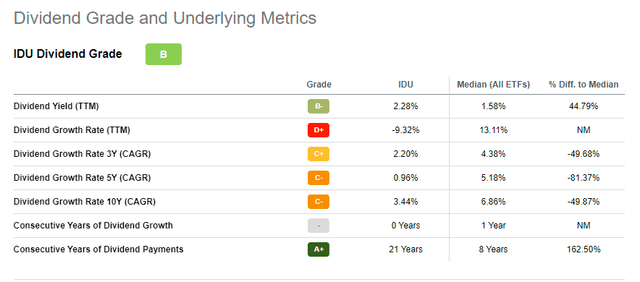
Seeking Alpha gives IDU a “B” Dividend Grade because of its relatively low 2.28% yield and the fact that its dividends declined over the last twelve months. IDU’s 21 consecutive years of dividend payments don’t appear to be the main criterion in calculating the grade, since the same is true for XLU, which has an “A+” Dividend Grade.
Seeking Alpha
Assessing an ETF’s dividend history isn’t the same as assessing an individual company’s history, and most of IDU’s constituents are consistent growers. Instead, the 9.32% decline most likely has to do with when the ETF received distributions from its underlying holdings versus when they were distributed to IDU shareholders. I expect this to even out in the long run, considering how IDU and XLU are similar in many respects and have a ten-year dividend growth rate of around 3.50%.
In contrast, the 2.28% dividend yield likely won’t improve, at least in relation to XLU, which yields 2.71%. The reason is that the 0.41% expense ratio directly impacts distributions. High fees are damaging not just because they reduce total returns, but because they have the potential to alienate a key investor demographic: dividend investors. Since XLU’s assets under management are 16x IDU’s, it’s clear that most dividend investors prefer low-cost products, as they should in most cases.
Factors Affecting Utility Stocks
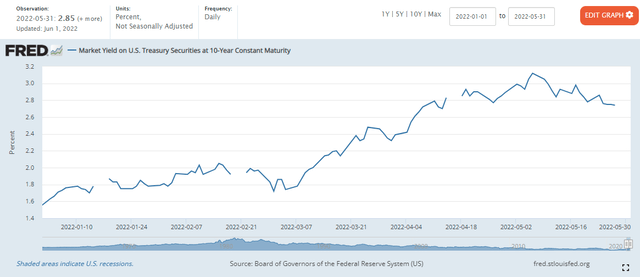
As mentioned before, rising interest rates don’t equate to poor returns for utilities. The graph below shows how the yield on ten-year treasuries has increased from 1.63% to 2.85% this year.
St. Louis Federal Reserve (FRED)
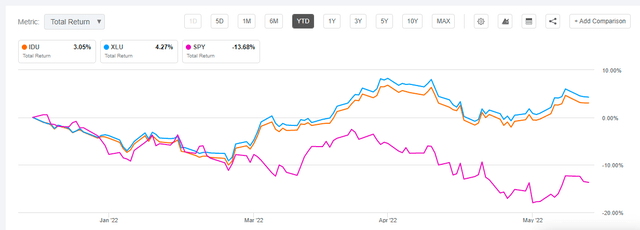
Yet IDU and XLU have managed to earn a small gain in 2022 while SPY is down 13.68%.
Seeking Alpha
It’s one example, but in my previous article, I found virtually no link between utilities’ yield premium over treasuries and excess returns over the S&P 500. From 2000 to 2008, when treasuries yielded more than utilities, IDU and XLU significantly outperformed SPY in 2000, 2004, 2005, and 2007. From 2009 to 2022, when the situation mostly reversed, IDU and XLU also had good years in 2011, 2014, and 2022. However, they performed poorly in 2009, 2012, 2013, 2020, and 2021. In my view, analyzing treasury yields in relation to IDU or XLU’s yield isn’t helpful. It’s misleading at best and harmful at worst, and it’s time to consider other factors that affect utilities, including:
Market Sentiment
It’s often ignored and not easily measured, but being able to gauge when investors are feeling confident or nervous is crucial to investing in any security, including utilities. Some investors prefer technical analysis, while I rely on economic data and earnings surprise figures. From Q2-Q4 2021, S&P 500 earnings surprises had declined for three consecutive quarters, signaling that less risky assets were preferable. Also, the yield curve briefly inverted in early April, signaling we may be on the verge of a recession. Earnings surprises and the yield spread were on their way down fast beginning in late 2021, so it just made sense to go for the least-risky equity sector: utilities.
For Q1 2022, earnings and revenue surprises remained relatively flat compared to Q4 2021. That’s a welcome sign for markets but not necessarily for IDU. For me, it’s not a sign that sentiment is positive again, but taking some gains may be prudent. The risk of a recession is still high enough to maintain solid exposure to the sector, but riskier assets could become more favorable soon. We saw how quickly markets recovered in Q1 2020, and on the chance that happens again, conservative investors may be left behind again.
Higher Allowable ROEs
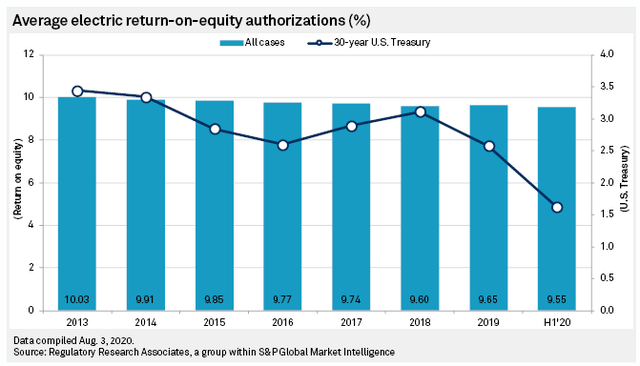
On the plus side, higher interest rates should equate to Public Utility Commissions, or PUCs, allowing electric utilities a higher return on equity. Higher ROEs don’t necessarily mean higher stock returns, but eventually, stronger profits will work into a company’s share price. The graph below shows the declining trend in ROE authorizations and importantly, their correlation with long-term treasuries.
S&P Global Research
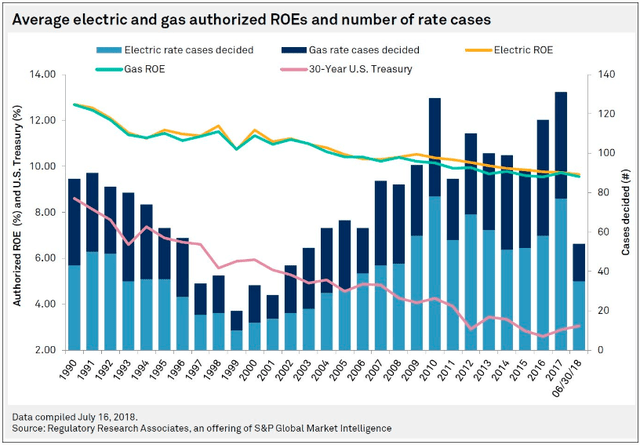
Similar research in 2018 provides a longer lookback to 1990. Average ROE authorizations for electric and gas utilities have been below 10% since 2014, with researchers writing that “over the past several years, the persistently low interest rate environment has put downward pressure on authorized ROEs.” Now that 30-year treasuries yield 3.07%, up from 1.91% to begin the year, it’s reasonable to expect PUCs will allow a higher ROE.
S&P Global Research
IDU vs. XLU: Comparing Fundamentals
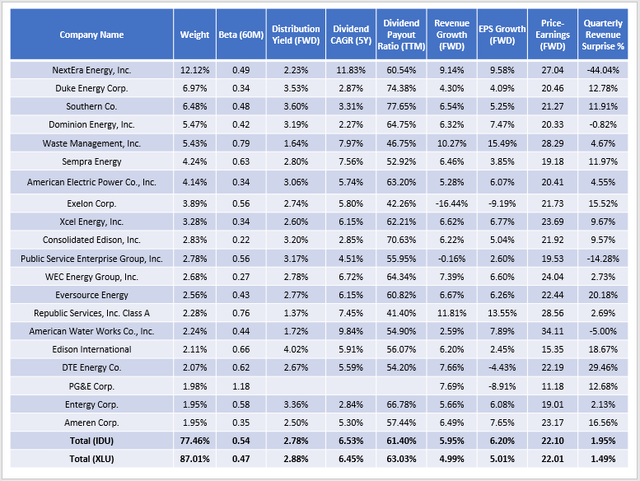
The table below compares IDU and XLU on a fundamental level. I’ve provided metrics for IDU’s top 20 companies, which total 77.46% of the ETF, and the summary metrics for both funds are in the final rows.
The Sunday Investor
The ETFs are very similar from a gross dividend yield and growth perspective, but due to the reasons mentioned earlier, XLU is the better choice. The two also have forward price-earnings ratios of about 22x, so neither has a valuation edge.
The tradeoff appears to be in three areas: diversification, growth, and volatility. IDU is better diversified with 10% less concentration in its top 20 holdings and may be better suited for investors looking to capture the entire sector across all market cap sizes. IDU also has a slightly better estimated revenue and earnings growth rate, primarily attributable to weighting differences. Both ETFs have exposure to slow-growth stocks like Duke Energy (DUK), Sempra Energy (SRE), and Exelon (ERC). However, IDU’s exposure to these three is about 3% less. It’s not much, but might provide an edge in a bull market. That’s further supported by its higher beta (0.54 vs. 0.47), but that’s a good thing only if you believe markets are heading upward. I’m optimistic that the bottom is in or near, but the data isn’t convincing yet.
Investment Recommendation
IDU is a solid ETF, but its high expense ratio is off-putting to dividend investors who depend on a decent, growing yield. Especially given how an excellent alternative exists with XLU, there aren’t many good reasons to buy it. IDU may be able to offset its higher fees in a bull market due to its more substantial growth potential, but I’m not yet able to confirm market sentiment has turned positive again. Therefore, my rating on IDU today is only neutral despite a favorable view of the utilities sector, and I encourage investors to consider switching to XLU if possible.
[ad_2]
Source links Google News

