[ad_1]
Investment Thesis
Despite the fact that the iShares MSCI EAFE ETF (EFA) pays a stable dividend covered by net investment income and matches the size of competitors in the foreign equity universe, it commands a much higher expense ratio, while managing a smaller portfolio than its peers. In this article, I will review the major characteristics of EFA, provide a comparison between EFA and a few of its ETF peers, and demonstrate that EFA is not the best ETF in its asset class.
Basic Fund Information
Based on the investment objective listed on the fund’s website, EFA “seeks to track the investment results of an index composed of large- and mid-capitalization developed market equities, excluding the U.S. and Canada.” As the fund’s name implies, it is based on an index maintained by MSCI Inc. (MSCI) which measures the performance of developed markets in EAFE (Europe, Australasia and Far East) countries. The fund is almost 18 years old, having been established on August 14, 2001.
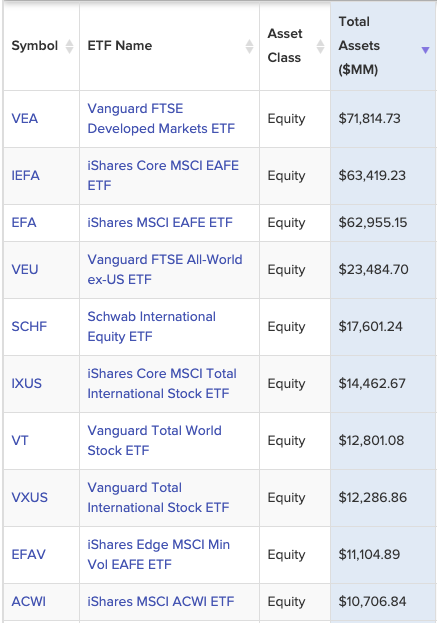
A quick search of the foreign developed market ETF universe (courtesy of ETFdb.com) shows that among the ten largest ETFs in this group with total assets over $10 billion, EFA ranks as the 3rd largest at just under $63 billion in total assets:
Distributions
EFA pays distributions biannually (twice per year) in June and December. As shown in the “Distributions” chart below from the fund’s website, EFA has paid steady dividends for the past eight quarters, none of which were classified as return of capital:
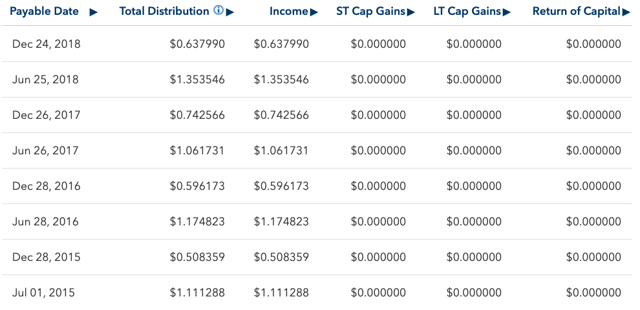
The last two dividends distributed totaled $1.99 per share. Based on EFA’s closing price from the most recent trading day (04/26/2019), the distribution yield is 3%. Of the 10 similar foreign developed market ETFs shown in the ETFdb chart above, EFA’s yield ranks in the middle of the pack. The honors for highest yield in this group go to another iShares fund: the iShares Core MSCI EAFE ETF (IEFA) with a yield of 3.1%, only slightly higher than EFA’s yield.
Liquidity and Expense Ratio
A quick review of EFA’s data on Yahoo Finance shows that this fund trades an average of about 24 million shares per day, indicating more-than-sufficient market liquidity. In terms of the expense ratio, EFA’s website reports a figure of 0.31%, making its expense ratio the 9th highest out of the ten ETFs mentioned earlier.
For investors seeking an even lower expense ratio from an ETF in this asset class, you may want to consider some of the funds below that are listed first:
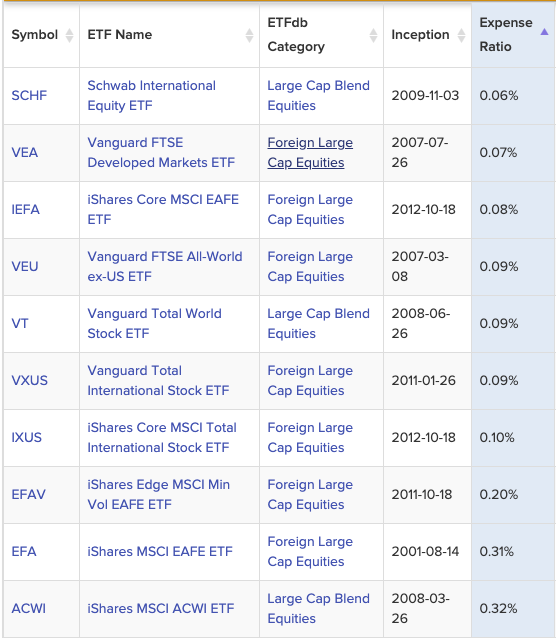
To put this point into stark contrast, fellow Vanguard fund VEA (the Vanguard FTSE Developed Markets ETF) has an expense ratio 1/4th lower than EFA, yet, as shown below in the next section, its portfolio contains twice as many equity holdings. EFA is definitely not the asset class winner on efficiency and low cost.
Portfolio Holdings
EFA’s portfolio contains 925 holdings per the fund’s website. This places EFA on the smaller side of this group in terms of portfolio holdings. The largest portfolio of the group, IXUS (iShares Core MSCI Total International Stock ETF), has 4,430 holdings, followed by IEFA (2,666), VEA (1,858), ACWI (iShares MSCI ACWI ETF; 1,473), SCHF (Schwab International Equity ETF; 1,355), VEU (Vanguard FTSE All-World ex-US ETF; 1,125), and then EFA.
Some of EFA’s top holdings include Nestlé (OTCPK:NSRGY), Novartis (NVS), HSBC Holdings (HSBC), and BP plc (BP).
Performance
As shown on the chart below from EFA’s website, the fund’s performance closely tracks its benchmark for all years listed, indicating an effectively managed index ETF:

When compared to five of the other largest developed market ETFs (by net assets), EFA’s 1-year returns are in the upper half of the group (shown below; note – these are all losses):
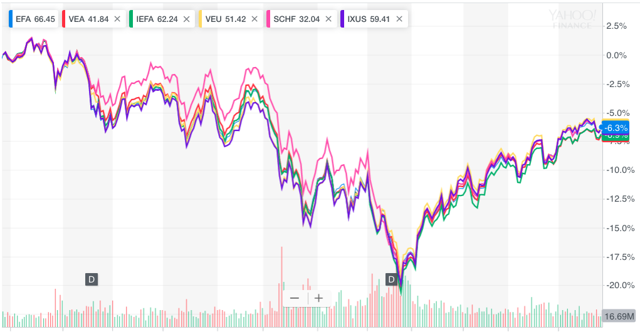
Slightly edging out the group is VEU, with a 1-year return of -6.4%, closely followed by IXUS and EFA itself (both about -6.3%). The lowest return of the group (though only slightly below the rest) from VEA at -7%
Last two qualitative screens
Before making a purchase decision, I always look at the equity’s chart to get a feel for price movements and where the current price falls as compared to the fund’s long-term history. I also review the most recent financial report to determine the level of a fund’s assets and liabilities and the effectiveness of its operations. In my opinion, reading the entire report is the most important part of sound due diligence.
Price History
To begin with price, below is the price chart for EFA’s entire trading history since its inception (courtesy of Yahoo Finance):
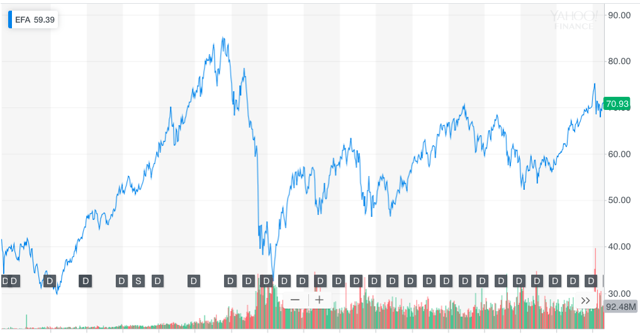
As you can see, EFA’s price climbed steadily to a peak in 2007, which was at the initial stages of the subprime mortgage crisis. As the crisis developed, the fund’s price dropped into the low $30s during 2009. Despite several large peaks and valleys, as of today, EFA trades at $66.43/share, which is about $20 below the highest price that it ever achieved late in 2007.
To make a final purchase decision, I will generally review the 1-month, 3-month, and 6-month charts to determine an entry point. EFA has been steadily recovering from a dip that occurred right around the end of December 2018 and is now on the higher end of its 1-year performance. For this reason, if I were adding a position in this fund, I would do it over a period of 15-30 days. Like Jim Cramer says, if the price goes up, great! And if not, you still have funds available to purchase the investment at a cheaper price. (Note: Adding to a position incrementally, even in small dollar amounts, is easy to do using Folio Investing’s dollar-based trading platform).
Finally, the last and most important piece of my review is to read EFA’s financials. The most recent report available from the fund’s website is the 2019 Semi-Annual Report (dated January 31, 2019). Additionally, I recommend reading the fund’s annual report, especially if you hold this ETF in your portfolio. The major sections of the report are summarized below.
Fund Summary (p. 10)
The stated annualized expense ratio of 0.32% is almost identical to the 0.31% figure on the fund’s website. Of note, almost 20% of the portfolio’s sector allocation is invested in financials, followed by industrials at about 14%. The major country allocations are to Japan (24.6%), the United Kingdom (16.6%), and France (10.9%). The almost 1/4th portfolio allocation to Japan catches my attention and is a risk factor to keep in mind as a part of the investment decision.
Schedule of Investments (pp. 46-56)
As stated on the fund’s website, with a few exceptions, EFA’s holdings consist almost exclusively of foreign developed market equities. It holds cash positions in two BlackRock money market funds (customary for an ETF), but also holds rights to a Spanish company (which expired 02/05/2019) and long futures contracts in the ASX SPI 200 Index (Australia), the Euro STOXX 50 Index (eurozone), the FTSE 100 Index (United Kingdom), and the TOPIX Index (Japan). The holdings are exactly as they should be, and I do not see anything to be concerned about.
Statement of Assets and Liabilities (p. 75)
EFA’s balance sheet shows $65.239 billion in assets, $64.650 billion of which represent investments in securities. A statistically insignificant total of $238 million in liabilities results in net assets of just over $65 billion, slightly above the $62.9 billion figure shown on the fund’s website.
Statement of Operations (p. 77)
On the income statement, the fund earned $753 million of investment income for the six-month period of the report. Less investment advisory fees of almost $106 million, EFA sits at a net six-month profit of about $647 million, keeping about $0.86 for every $1 of revenue that it receives. (Note: Taken as a percentage of net assets, the investment advisory fee is 0.16%. This is significantly lower than the stated 1% advisory fees that I discovered in similar analyses of IYR (iShares U.S. Real Estate ETF) here and CLM (Cornerstone Strategic Value Fund) here. Page 94 of the financial report indicates that EFA’s fee is actually 0.28% based on its net assets, so the actual fee paid appears to be less than that amount.
Statement of Changes in Net Assets (p. 80)
Reviewing the Statement of Changes in Net Assets is critical to determining the source of a fund’s cash and any significant capital transactions. For the six-month period in question, EFA saw a net asset decrease of $7.8 billion, mostly due to a drop in the value of its investments and about $1.5 billion due to capital share redemptions.
The last, but possibly most significant, financial data lies in this last section below, which shows the changes in NAV during the period in question (in this case, August 1, 2018 – January 31, 2019).
Financial Highlights (p. 87)
Some encouraging figures are found on the very first line, reading: “Net asset value, beginning of period.” Starting in July 2014 at an NAV of $60.17, EFA has steadily increased its NAV to the 01/31/2019 figure of $62.77 (a modest increase of 4.32%). I notice right away that during 2016 and so far in 2019, about $6 of the NAV in each year was obliterated by decreases in investment value. However, compared to some other ETFs that I have reviewed in the past, the only years that EFA’s distributions were not covered by net investment income were 2018 and so far in 2019. It appears that foreign developed equities have hit a snag as of late. However, EFA has a stable history of profits.
Summary
For my own purposes as a passive, long-term, index fund investor, EFA is definitely an appropriate ETF for foreign developed equity market exposure, as shown below. However, it may not be the best option in the bunch:
Positives:
- One of the top 3 largest funds in this asset class.
- Consistent dividends paid in June and December, with a yield representative of its peers.
- Closely tracks its index.
- Solid, strong balance sheet.
- Shareholder distributions are generally covered by net investment income, with a few minor exceptions.
Negatives:
- Has one of the smallest portfolios in its class, yet sports one of the highest expense ratios.
- Is on the higher side of its 1-year price range.
- Almost a quarter of the portfolio is allocated to Japanese equities, which presents a diversification risk.
You can see above that the positives outnumber the negatives, and as such, I believe that EFA is an appropriate investment for long-term, passive index portfolios, such as my own Ivy League portfolio (described here in another Seeking Alpha article). However, EFA is definitely not the best option out there! Two of the negatives listed above outweigh almost every other factor: a higher expense ratio despite a smaller-sized portfolio, and a large allocation to one country. For these two reasons, I would not select EFA as a best-in-class foreign developed equity ETF.
Note: In my own personal portfolio, I dispensed with selecting individual U.S., foreign-developed, and emerging market equity ETFs, opting instead to invest in the Vanguard Total World Stock ETF (VT).
Disclosure: I am/we are long VT, VEU. I wrote this article myself, and it expresses my own opinions. I am not receiving compensation for it (other than from Seeking Alpha). I have no business relationship with any company whose stock is mentioned in this article.
[ad_2]
Source link Google News

