[ad_1]
ETF Overview
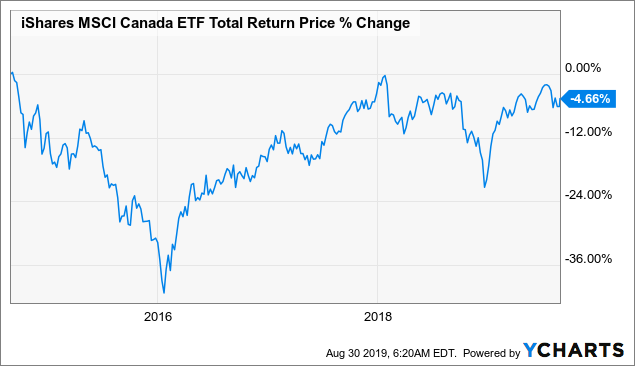
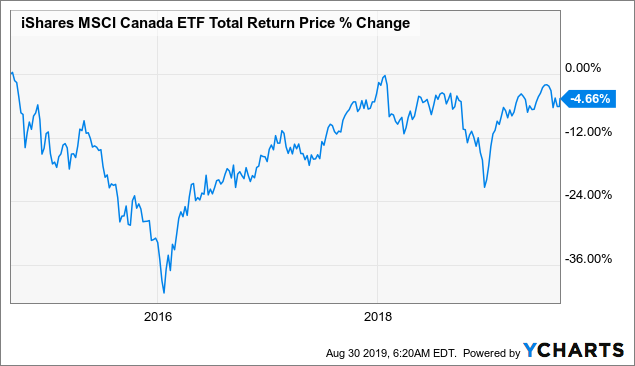
iShares MSCI Canada ETF (EWC) owns a portfolio of Canadian stocks. The ETF basically tracks the performance of the MSCI Canada Index. Most stocks in EWC’s portfolio belong to cyclical sectors. Stocks in EWC’s financial sector may continue to exhibit weakness due to elevated Canadian household debt and a deterioration of credit quality. In addition, the lack of takeaway pipeline capacity continues to weight on energy stocks in EWCs portfolio. Despite EWC’s cheap valuation, we do not see any near-term catalysts that will materially lift these Canadian stocks higher. Therefore, we think investors may want to wait on the sidelines.
 Data by YCharts
Fund Analysis
EWC has a high exposure to cyclical sectors
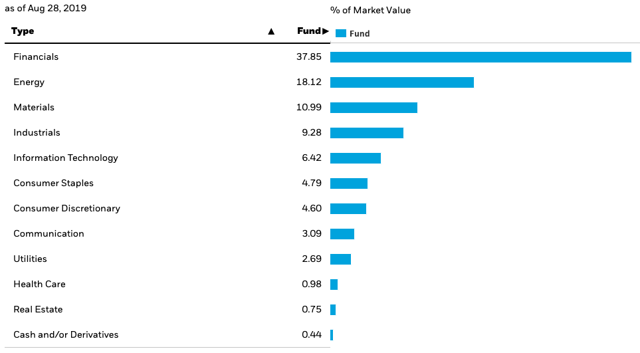
Cyclical sectors represent a large portion of EWC’s portfolio. As can be seen from the chart below, cyclical sectors such as financials (37.85% of the portfolio), energy (18.12%), materials (10.99%), industrials (9.28%), and information technology (6.42%) sectors represent nearly 83% of the total portfolio. Cyclical sectors typically underperform other sectors in an economic downturn or when the economy growth rate decelerates. Since we are likely already in a late cycle environment, it may be challenging for EWC to outperform other ETFs.
Source: iShares Website
Growth in Canada’s largest banks are decelerating
Financial sector represents nearly 38% of EWC’s portfolio. This sector is pretty much dominated by Canada’s six largest banks. As can be seen from the table below, these six banks represent over 26% of EWC’s portfolio.
|
Ticker |
Name |
Weight in EWC’s Portfolio (%) |
|
RY |
ROYAL BANK OF CANADA |
7.75 |
|
TD |
TORONTO DOMINION |
7.18 |
|
BNS |
BANK OF NOVA SCOTIA |
4.49 |
|
BMO |
BANK OF MONTREAL |
3.16 |
|
CM |
CANADIAN IMPERIAL BANK OF COMMERCE |
2.46 |
|
NA |
NATIONAL BANK OF CANADA |
1.15 |
|
TOTAL: |
26.19 |
Source: Created by author
In the bank’s quarterly earnings season that ended on August 29, these banks in general saw higher loan loss provisions, subdued margin growth, and capital markets weakness. In the past few years, these banks have seen very low credit losses while growing their loan portfolio at a good pace. However, the latest round of earnings report suggests that the goldilocks era has likely ended. As TD Bank Chief Financial Officer Riaz Ahmed said in an interview, “We’re starting to see some normalization of [credit losses]…Macro news around trade, Brexit etc. are creating uncertainties.”
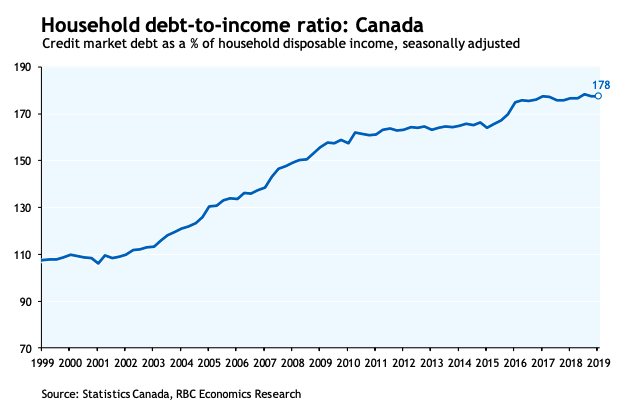
Looking forward, these banks are likely to continue to face strong headwinds as central banks on both sides of the border will likely cut interest rates this coming fall. Therefore, these bank’s net interest margins will likely be compressed. In addition, Canada’s record high household debt-to-income ratio means that these banks may find it increasingly challenging to grow its residential loan portfolio. As can be seen from the chart below, Canadian household debt to income ratio has now reached 178%. This is the highest level we have seen in several decades. Therefore, we think it may continue to be challenging for these banks to outperform in the near-term.
Source: RBC Economics
The lack of adequate pipeline capacity continues to weigh on the energy sector
About 18% of EWC’s portfolio consists of companies in the energy sector. These stocks have not performed well in 2018 and 2019 due to a weak global demand as well as there is a lack of pipeline capacity to ship oil out of Canada’s oil rich province Alberta. At one point, WCS and WTI differential had widened to as much as $50 per barrel. Because of the wide differential, the government of Alberta introduced the mandatory curtailment late 2018. It looks like this curtailment will continue through 2020 as the progress to build more pipeline capacity continued to be delayed. At the moment, Enbridge’s (ENB) Line 3 project will likely not reach completion until late 2020 or perhaps even early 2021. We believe it will be difficult to see any meaningful market rally on energy stocks in EWC’s portfolio unless we see more pipeline capacity added.
Valuation Analysis
EWC’s valuation is not expensive. Stocks in EWC’s portfolio currently trades at an average forward P/E ratio of 14.44x. This is nearly 4x multiples below the S&P 500 Index. Its price to cash flow and price to book ratios are also much lower than the S&P 500 Index.
|
EWC |
S&P 500 Index |
|
|
Forward P/E Ratio |
14.44x |
18.33x |
|
Price to Cash Flow Ratio |
5.00x |
9.54x |
|
Price to Book Ratio |
1.76x |
3.20x |
|
Dividend Yield (%) |
3.17% |
1.90% |
Source: Morningstar, Created by author
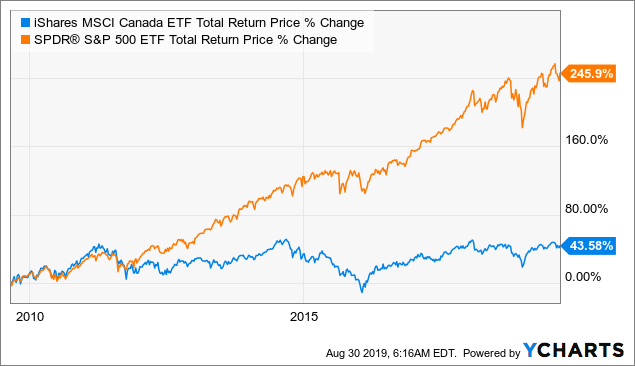
As can be seen from the chart below, an investment in EWC 10 years ago only yields a total return of 43.58%. This is much lower than S&P 500 Index’s total return of 245.90%.
 Data by YCharts
Investor Takeaway
We believe EWC is a good way to participate in the growth of the Canadian economy in the long-term. However, we think the Canadian economy may continue to face some headwinds in the near-term. Some of the issues such as the lack of pipeline takeaway capacity and elevated Canadian household debt will not go away very soon. Therefore, we think investors may wish to stay on the sidelines.
Disclosure: I am/we are long ENB, TRP. I wrote this article myself, and it expresses my own opinions. I am not receiving compensation for it (other than from Seeking Alpha). I have no business relationship with any company whose stock is mentioned in this article.
[ad_2]
Source link Google News

