[ad_1]
John Kevin/iStock via Getty Images
It is now six months since I published an article titled SPY: What Is The Outlook For The S&P 500 In 2022? In that article I was careful to avoid outright punditry and did not attempt to predict how the SPDR S&P 500 ETF Trust (NYSEARCA:SPY) that tracks the S&P 500 would perform in 2022. What I did do was flag several very worrisome valuation metrics that emerged from my analysis, though I ended that article with a reminder that the market might continue to ignore valuations as it had for most of the previous decade.
The Missed Valuation Warning Signs Pointing to SPY’s Vulnerability to a Severe Decline
Back near the end of December I concentrated my analysis on the 100 largest cap stocks held in SPY as at that time they made up 70% of the total value of market cap weighted SPY.
My analysis of those stocks turned up these troubling issues:
- Only 31 of these 100 top stocks had P/E ratios that were lower than their 5-year average P/E ratio. In some very high profile stocks the only reason that their P/E ratio was less than their long-term average was because, as was the case with Tesla (TSLA) or Amazon (AMZN), they had had extremely high P/Es in the past five years due to having extremely low earnings and enormously inflated prices.
- A whopping 72 of these 100 top stocks were already priced at or above the one-year price target that analysts were forecasting for those stocks.
- The S&P 500’s extreme price appreciation over the brief post-COVID period had driven its dividend yield so low that at the end of 2021 the backward looking yield for SPY was only 1.22%. Its forward-looking SEC yield was even lower at 1.17%. This mattered because there have been long periods of time in Market history when the only gain investors received from a decade-long investment in the S&P 500 had come from its dividends and dividend growth. But SPY’s dividend was so low that even if dividends grew at their average rate investors who bought in December 2021 were locking in dividend rates less than 1.5% for years to come.
If valuation matters, I wrote, these are very troubling metrics.
The Reasons Why Investors Believed SPY’s Valuation Did Not Matter
I balanced this warning with a reminder that three factors had kept valuation from mattering for most of the past decade. They were as follows:
- Fed’s dedication to suppressing interest rates which gave investors needing income no alternative to buying stocks, no matter how much they were having to pay for their stocks’ dividends.
- The extent to which the performance of just a handful of highly visible momentum-driven Tech growth stocks with extremely large market caps had driven the performance SPY.
- The move over the past five years for retirement plans and advisory services — especially cheap robo-advisors — to push investors into a handful of large cap ETFs and index funds whose value was concentrated in the same handful of stocks that dominate SPY. I speculated that the latter factor could keep the momentum of those top stocks going since so many investors now invested in top-heavy large cap index funds with no idea of what they were actually buying.
In retrospect, though I didn’t make the kind of headline-hitting price prediction that pundits and sell side analysts publish, I should have. The valuation issues I flagged turned out to be very relevant. People who get paid thousands of times more than I do to make their predictions have ended up looking like fools. Bloomberg News tells us, “just about everyone on Wall Street got their 2022 predictions wrong.”
Two Gray Swans Have Pushed the S&P 500 into a Bear Market
The pundits can be excused for their wrong calls. They assumed that COVID-19 and the supply chain disruptions it had caused were the reason that inflation had risen, and that as they were both fading, inflation would too. Instead China experienced a resurgence of COVID-19 that made it lock down whole manufacturing centers and Russia invaded Ukraine, teaching the rest of us just how much the world’s oil supply depends on Russia.
With inflation continuing to run at a rate above 8% for months and gas prices doubling, the multimillionaire bankers running the Federal Reserve suddenly remembered that the Fed has a mandate that requires it to fight inflation, not just to prop up the stock market that had made them and so many others of the 1% extremely wealthy.
The Fed’s timid raising of rates to levels that would have been considered laughably low 15 years ago has provoked the punditry into a frenzy of tooth gnashing along with daily predictions that should rates ever reach 4%, the U.S. will suffer a catastrophic economic collapse. Apparently without zombie companies being able to stay alive by borrowing vast sums at near zero interest rates our economy is toast.
Is Now a Good Time to Consider Buying SPY?
The S&P 500 has responded by dropping into bear territory. So the question now is whether it has corrected enough to make it a good buy again, or if the decline will continue.
SPY is down over 20% as I write this. Many of the same highly paid Wall Street professionals who made all those inaccurate, optimistic predictions back at the end of 2021 are now predicting that the market will continue to decline another 15-20%. The current consensus figure for the S&P 500’s growth over 2022 is now only 1%, down from the 4% that was predicted back when I wrote my December article about SPY.
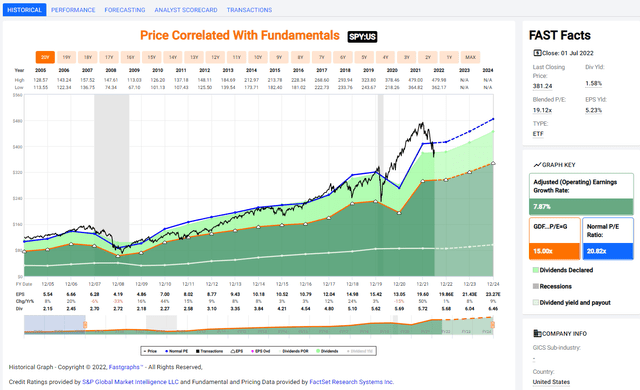
SPY’s Historical Price, Earnings, Dividends, and Analysts’ Forecasts
fastgraphs.com
The contrarians among us are urging us to buy, reminding us of Warren Buffett’s advice to “be greedy when others are fearful.” Bears are pounding the drum for cash, citing Warren Buffett’s other famous dictum: ” Rule No 1: never lose money. Rule No 2: never forget rule No 1.” Who should you believe?
To answer the question in the title of this article, I reran the analysis I did in December 2022. I wanted to see how the valuation metrics I had examined had changed and I also wanted to see if the factors that had propped up the S&P 500 for the past decade, through good economic times and bad, might still be operating.
SPY’s Key Metrics
SPY’s Official Price/Earnings Ratios – Forecast and Current
State Street Global Advisors (SSGA) tells us that a metric it calls the “Price/Earnings Ratio FY1” of SPY is 16.65. This is a forward-looking P/E ratio that is based on analysts’ forecast of what SPY’s annual earnings will be in a year.
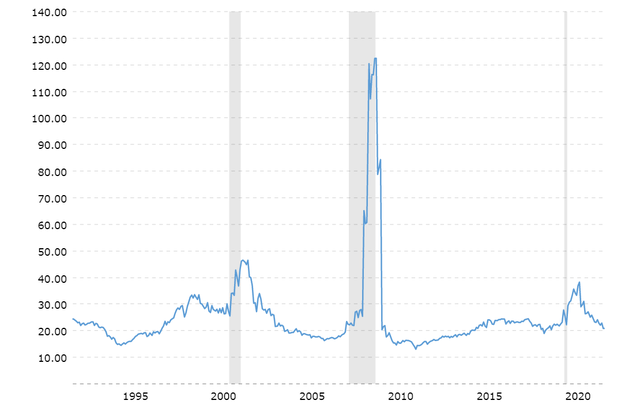
Back in December, SSGA reported the same metric as being 25.37. Today’s 16.65 is well below that December number. It is also below the 20 P/E which has been the historical average P/E ratio of the S&P 500 going back for three decades. It’s even less than the P/E ratio of 17 that has in the past flagged excellent times at which to buy into the S&P 500.
Average S&P 500 P/E Ratio – Last 30 Years
macrotrends.net
But we must be very wary of estimates based on earnings forecasts stretching out for a whole year. SSGA doesn’t provide SPY’s current P/E ratio but it does tell us that the current P/E ratio of the S&P 500 index is 18.38.
That 18.38 is still a much better valuation than what we saw at the end of December when SPY’s P/E was 24.23. But we don’t know exactly what data is used to calculate that P/E. We also don’t know what corporate earnings will look like over the next six months as the price of oil drives up transportation, materials, and overhead costs.
Calculating an Indicative P/E Ratio for SPY Using Those of Its Major Holdings
Back in December, I turned to the 100 top stocks in SPY to get a better feeling for what the P/E ratios of those stocks might be like, as I don’t really trust the weighted harmonic averages fund companies use to calculate a P/E ratio for a weighted index. I calculated the weighted P/E ratio of those 100 dominant stocks myself, letting each stock contribute its share to the total P/E ratio for the ETF in accordance with its weight. In December that method gave me a P/E ratio of 26.08 for those 100 stocks. This was just a bit higher than the 25.37 harmonic weighted average that SSGA reported.
Now when I repeat this calculation, the average weighted P/E of the Top 100 stocks in SPY comes out to be 16.51, which is very close to the harmonic weighted average for all of SPY that SSGA reports. But we must remember that the earnings for the second half of 2022 could be much lower than what they have been until now, which would push up P/E ratios unless stock prices fall further.
How Many Stocks’ P/E Ratios Are Now Below Their 5 Year Historical Average?
The number of stocks whose P/E Ratios were lower than their 5-year historical average had been very low back in December. That has changed, too, with the current bear market correction. In December, only 30 stocks in the Top 100 stocks ranked by weight in SPY had P/E ratios that were below their historical 5-year averages. Several of those were stocks like Tesla that had tiny earnings and huge prices, raising their P/E ratios to extreme heights. Now that number has reversed. Only 31 stocks in that Top 100 have P/E ratios that are greater than their 5-year historical average P/E.
This last measure of how individual stocks P/E ratios compare to their individual historical averages is important because stocks in different industries or at different stages of maturity can be well-valued at very different P/E ratios. A P/E ratio of 15 for an established regional banking stock might be way too high, while that same P/E ratio of 15 for a young tech stock that is growing earnings steadily might be a sign that the stock is a bargain. The widespread drop in the P/E ratios of so many of SPY’s major holdings relative to their 5-year average P/E ratio suggests that the correction has reached very deeply into most of the holdings of SPY and is not just confined to a few sectors.
How Have the Forecasts for EPS Growth Rates Changed?
SSGA tells us on the SPY product page that the Mean Estimated 3-5 Year EPS Growth rate of the stocks in SPY is currently 12.57%. This is taking into account estimates from FactSet, First Call, I/B/E/S Consensus, and Reuters. This represents a significant decrease from the December 2021 forecast. At that time SSGA reported that the 3-5 year estimated EPS growth for all of SPY was 17.96%.
Even so 12.57% is still a robust earnings growth rate. In an environment where corporate energy and transportation costs have doubled and wages are rising due to a worker shortage from so many workers retiring or joining the gig economy, it is as likely that earnings will decrease as that they will rise. Factor in, too, that consumers are facing skyrocketing costs for basics like food, rent, heat, and transportation, which lowers demand for corporate products.
Is SPY’s Value Still Concentrated in a Small Number of its 504 Stocks?
Back in December, the Top 100 stocks in SPY, ranked by weight, made up 69.8% of the value of the entire ETF. They currently still make up 68.4% of that value, which represents a very minor decrease. The Top 10 stocks held by SPY made up fully 29.7% of its total value in December. They currently make up 27% of that value. Though that represents a significant decrease, it still leaves investors in SPY heavily dependent on the performance of those 10 mega cap stocks. Below you can see some selected metrics for these top 10 stocks from Fastgraphs.
Selected Metrics for SPY’s Top 10 Stocks

Data from Fastgraphs from Factset and S&P Global. Table by the Author
As you can see, the prices of most of these stocks is still currently above their 1-year price targets. Their P/E ratios have corrected to some extent, but are not signaling that these stocks are bargains, especially now when we compare their growth-stock-like P/E ratios with their relatively modest forecasted annual earnings growth rates for the next 3-5 years.
What does SPY’s Dividend Yield Tell Us About Its Valuation?
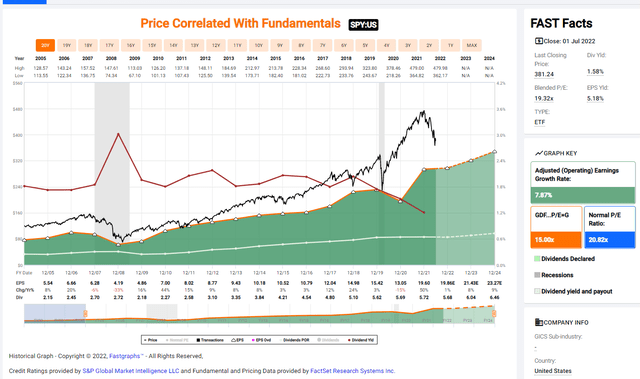
Below you can see a Fastgraph showing how SPY’s price (black line), dividend yield (brown line) and EPS (orange line) have varied over the past 20 years. The Dividend Yield scale is depicted on the right hand Y axis.
SPY Price, Dividend Yield, and Earnings – 20 Year History
fastgraphs.com
Throughout most of this 20-year period, with the exception of the Financial Crisis in 2008 and the COVID-19 period after December of 2019, SPY’s yield has fluctuated between 1.75% and 2.00%. Even as SPY’s stocks’ prices and earnings rose, their dividends rose enough to keep a relatively steady yield. This ended with the huge run-up in stock prices that occurred during the COVID-19 pandemic. That drove down SPY’s dividend yield to a historic — and ominous — low.
At the end of the Bull Market on December 31, 2021 Seeking Alpha’s Dividend Yield feature tells us that SPY’s yield was only 1.20%. Many investors believe that a sharp decline in dividend yield like this one is a sign of over-valuation, and I am coming to think they are right.
As of now, Seeking Alpha tells us that with SPY’s second quarter dividend declared, SPY’s current yield is now 1.58%. This is a significant rise in yield– 31.7%. But it is to a great extent the result of falling stock prices, rather than of dividend growth. SPY’s dividend growth appears to be proceeding at a rate of only 15% a year, based on how the July payout of $1.58 a share due this July compares to the July 2021 payout of $1.38. And 1.58% is still below the range that SPY’s dividends have trended around historically.
A Fair Price Calculation Using Historical Dividend Yield Shows SPY Has Further to Drop
We might ask ourselves what price for SPY would give investors a yield more in line with that 1.75% – 2.00% yield that prevailed over much of its recent history. We can easily calculate that. Seeking Alpha tells us that SPY paid out $6.0074/share over the past four quarters that includes the coming July payout that has already gone past its ex-dividend and record dates.
The share price for SPY that would result in a yield of 1.75% would be $343.28. The share price that would result in a yield of 2.00% would be $300.37. With SPY’s current share price still at $381.24, it’s clear that SPY’s share price has a lot farther to drop before it could provide investors with the kind of yield they were accustomed to earning over the past two decades.
Furthermore, if corporate costs continue to rise significantly while corporate borrowing costs surge as interest rates increase, corporate dividends may be the first casualty.
Is SPY A Good Buy During A Recession?
I have harped on how inflation and the current oil shock may damage corporate earnings going forward. Some pundits are already declaring that the world is headed into a recession. So we have to ask how SPY will hold up in a recessionary economy.
To answer that question, we need to examine the amount of debt that is being carried by SPY’s stocks. If high inflation persists, it will stress corporations that are holding a lot of debt in ways that they have not been stressed over the past 20 years during which rates relentlessly plodded downwards. That’s because they will have to refinance that debt at higher rates, reducing their net earnings and the money available for dividends and buybacks. Investors today need to pay more attention to corporate debt than they have had to through the era of near zero rates.
With that in mind, I took a look at the quality of the long-term corporate debt currently being carried by the Top 100 stocks that make up almost 70% of the value of SPY and the S&P 500. After downloading the information about the ratio of Long Term Debt to Capital of the top 100 stocks in SPY, I calculated that the average Long Term Debt/Capital ratio of these 100 companies was 45.14. The weighted Long Term Debt/Capital I calculated for those stocks was slightly less, at 40.30%. This suggests that the largest cap companies in the S&P 500 are slightly less indebted than the rest of its stocks.
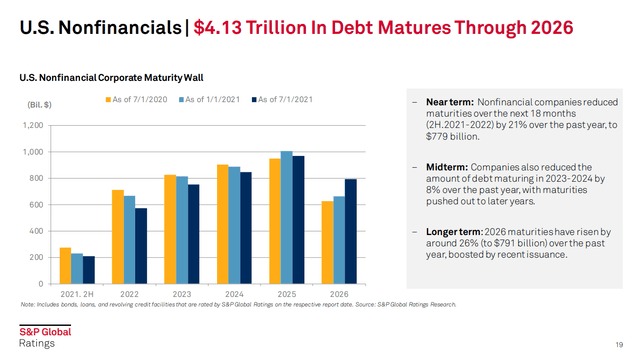
Long Term Debt/Capitalization Ratios below 50% are supposedly good ratios. But I wonder if that judgment is based on decades of declining interest rates which made refinancing long term debt cheaper. Below you can see a PowerPoint slide provided by S&P Global in mid 2021. It shows the amount of corporate debt that will mature in just a few years. Note that in 2021 S&P Global was defining Long Term debt as debt that would mature in 2025 and 2026, which really isn’t that far away.
www.spglobal.com/_assets/documents/ratings/research/100544297.pdf
When that surge of debt due in 2025 comes due, it will probably have to be refinanced a higher rates unless inflation miraculously subsides. That might call into question just how healthy it is for a company to have debt levels as high as what we are seeing today.
How Are SPY’s Top 100 Stocks’ Credit Ratings?
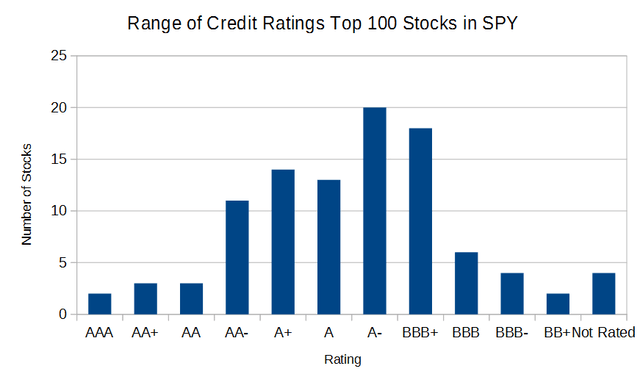
Below you can see how the credit ratings of the Top 100 stocks in SPY are distributed.
Data from S&P Global via Fastgraphs. Graph by the author.
As you can see, the credit trends around an A- rating. That is a lot better than what we see with the bulk of corporations trading on the U.S. stock market now. A full 44% of the investment grade corporate bonds held in the Vanguard Total Bond Market ETF (BND) are rated BBB+ or lower, and BND doesn’t hold bonds of the many US companies whose credit rating is below investment grade. In contrast, only 34% of the stocks in the top 100 of SPY are rated below A-. Only two stocks in this group have credit ratings below investment grade: Tesla and T-Mobile (TMUS).
As those of us who lived through 2008 can attest, the big question is how current those credit ratings are and how valid they might be. The BB+ credit of Tesla, one of the 10 largest cap stocks in SPY is a concern, but as you can see, the credit ratings of the other top 10 stocks, which you will recall make up 27% of SPY’s total value is very high.
The Higher Credit Quality of SPY’s Holdings May Give it an Edge Over Other ETFs in a Recessionary Period
The stocks in the S&P 500, unlike those in most other large cap ETFs, must have at least a year’s history of profitability. Once they pass that screen, a committee of humans, rather than an algorithm, selects the stocks it believes to be the best representatives of their sectors. This emphasis on profitability may make SPY or any other ETF that tracks the S&P 500 a better investment during a prolonged inflationary period than an investment in total market ETFs like the Vanguard Total Market ETF (VTI) that hold all stocks listed in the U.S., no matter how much money they lose each year in pursuit of what are often largely imaginary future profits.
Will the Fed Be Forced to Raise Rates Even in the Face of a Prolonged Recession?
Most of the analysts active on Wall Street and most investors still active in the workforce have not lived through a prolonged period of inflation. The past decade has trained them to believe that if the economy contracts, the Fed will immediately drag rates back to a near-zero level, causing the market to soar. This brought us into the era of “Bad news is Good news” as bad economic news made it more likely rates would fall, allowing companies to borrow cheaply to make up for any shortfalls in revenue and fund stock buybacks and dividends.
But this past month Jerome Powell made it clear that the Fed aims only to get its neutral rate back near 2%, far away from the 0% where it has hovered for years. Powell has also said that they are willing to let rates rise over that level if needed — even if it provokes a recession.
Nobody trusts the Fed, for good reason. What they will really do is unknown. But what we do know is that the forces driving inflation are not controlled by central banks. If oil prices stay high, Chinese manufacturing continues to stall, and labor shortages continue to drive up wages, the Fed’s hand may be forced. If they allow rates to rise in response to inflation, we may actually enter a period where, for the stock market, bad news is actually bad news, and stocks will no longer soar when there are signs that the economy is deteriorating. The shock that will echo through markets when investors finally get the message that the punch bowl has truly been snatched away and that the helicopters dropping money have been retired to their hangers, the response may be a far deeper dive in stock prices as investors flee to fixed income alternatives paying far higher rates than we have seen in 20 years.
Is SPY Worth Investing In Long-Term?
In previous articles where I looked at the various ETFs that track the S&P 500 I have noted that SPY’s expense ratio, which is a hefty 0.0945%, makes it less attractive than the Vanguard S&P 500 ETF (VOO) or the iShares Core S&P 500 ETF (IVV), both of which have expense ratios of 0.03%.
Over the very long term, those other ETFs have provided better returns than SPY.
S&P 500 ETFs’ Comparative 10 Year Total Return

Seeking Alpha
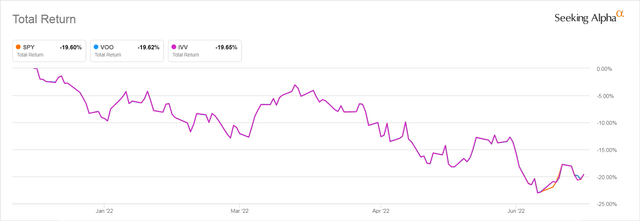
However, it has been very interesting to note that since the beginning of the current downturn, SPY has actually been providing slightly better returns than the others. This may be because these ETFs pay out their quarterly dividends at different times.
S&P 500 ETFs 6 Mo Total Return
Seeking Alpha
But reviewing all these charts, I have had to conclude that despite its much higher expense ratio, SPY seems to have returned an amount close enough to its competitors to make it worth considering, though I would be more inclined to invest in IVV as it slightly outperforms in most of the time periods you can examine using Seeking Alpha’s Charting Comparison feature.
Investors who trade options based on their holdings will want to invest in SPY rather than its competitors as it trades at a far higher daily volume than they do and its option market is far more active.
Is SPY ETF A Buy?
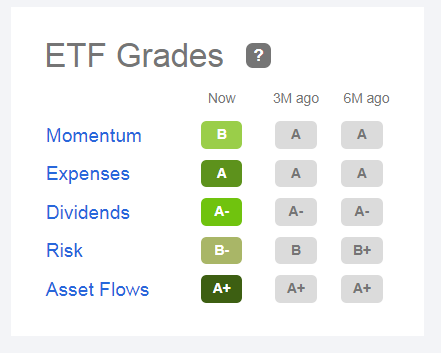
The warnings that were flashing six months ago have mostly abated. Using classic valuation metrics, SPY looks like a buy right now. Seeking Alpha’s Quant Rating system certainly sees it that way.
SPY’s Current Seeking Alpha Quant Rating
Seeking Alpha
But as you can see, the Quant Rating system also thought SPY was a buy six months ago, before its share price dropped 20%. That kind of buy I can do without!
I’m Going to Sit On My Hands and Watch Closely Waiting for a Better Entry Point
I am happy with the fixed income ladder I’m slowly building out of CDs and Treasuries paying over 3%. That doesn’t keep up with inflation, but I am still left with a lot more money than I would have had if I had not pulled back from stocks and ETFs over the past couple months. Remember, too, that the money left in those stocks and ETFs has lost the same amount of buying power as my Fixed Income has, but has also lost principal, which my fixed income won’t do.
So while I intend to invest some cash that I am holding into an S&P 500 ETF, I’m not in a rush. I’m watching several factors very closely to help me decide when to buy in. Those factors are:
- Whether the CPI and PCE inflation numbers continue to remain at levels very near their current levels. Small variations of half a percent or so should not be interpreted as signs that inflation is decreasing until we have several months of that magnitude of decline behind us. If inflation continues we may be in for a long dead period in the stock market as happened in the inflationary 1970s — whose inflation was also triggered by an oil shock.
- How firmly the Fed adheres to its stated policy of raising interest rates above 2%. Too many investors still expect the Fed to ride to the rescue of their portfolios once again. If they don’t, the market could respond very badly. If they cave, the market may go up for a while, but the declines in earnings caused by inflation driving costs higher may still deliver another shock as investors realize that the Fed’s interventions no longer work.
- How strong are Corporate Earnings given the increased costs of energy and wages. Pay particular attention to the extent to which earnings are being boosted by corporate buybacks rather than profits derived from sales. Watch those Top 10 stocks that make up so much of SPY’s value extremely closely. When their market caps start to decline dramatically it’s may be time to start buying.
- What happens with future COVID-19 surges and whether China continues to invoke total shutdowns to counter them. Way too much of the goods we use are dependent on Chinese manufacturing. It will take decades to rebuild the manufacturing infrastructure U.S. corporations destroyed in their pursuit of cheaper and cheaper product.
- How far will other totalitarian dictators and dictator wannabes go now that Putin has set an example of just how much ruthlessness they can get away with. Markets do not respond well to global wars or coups in once democratic nations.
If You Are A Younger, Working Investor Keep Investing Small Amounts Monthly but Retirees Need to Be More Cautious
Over the very long term, which I consider 20 years or more, SPY or any other S&P 500 ETF is a fine investment and will build you a solid retirement nest egg if you invest a little at a time. But for retirees who can’t wait decades for their investments to recover from a prolonged recession this is not the time to buy. Fixed income is becoming a lot more attractive and is a much safer place to put money you might need for typical costly crises that occur with advancing age like a long hospitalization or the need to move to assisted living or pay for nursing care.
[ad_2]
Source links Google News

