[ad_1]

SusanneB/E+ via Getty Images
When the market faces uncertain times like these, investors naturally turn to investments they hope are safe havens. Decades ago that would have meant treasury bonds, but with rates hovering at historic lows and the Fed sounding like it might actually start raising rates, bonds no longer seem safe. Blue chip stocks used to also be seen as safer investments, particularly those that had long histories of raising dividends. But the extended suppression of interest rates has led to income-hungry retirees bidding up the share prices of most blue chip dividend-paying stocks to where reversion to the mean could be very mean indeed.
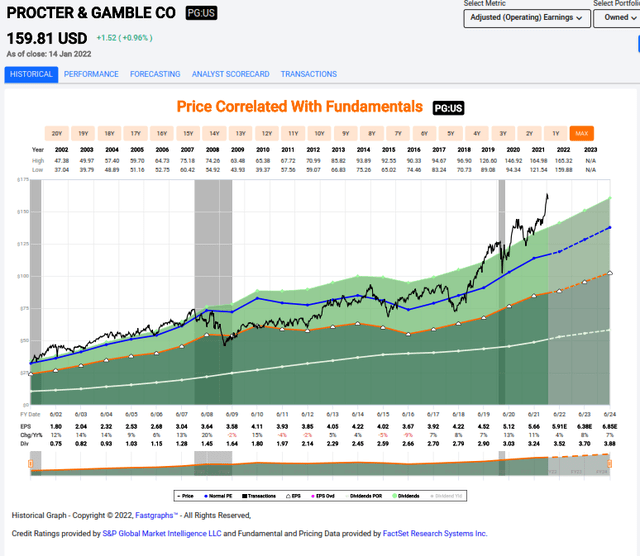
When a blue chip stock like Procter & Gamble (PG) is trading at a P/E ratio of 27.57 it is hard to consider it a safe haven. I’m using Procter & Gamble as an example here for a reason, as you will see further down in this article that it features heavily in several ETFs that focus on low volatility stocks.
Procter & Gamble 20 Year Price, Earnings, Dividend, and P/E history
Fastgraphs
Low Volatility ETFs Are Marketed with the Suggestion that They Won’t Drop as Far as the Market as a Whole in a Serious Decline
Given how few choices there are right now for truly safe investments it’s easy to be tempted by low volatility ETFs. These ETFs are built to capture the benefit of a supposed Volatility factor. To understand what investment professionals mean by “factors”, we need to look at some academic research.
The concept that stock investment returns can be enhanced by taking into account so-called “factors” was introduced by two economists, Eugene Fama and Kenneth French, back in 1993. They originally came up with a 3-factor model for stocks, claiming that 90% of a stock portfolio’s long-term performance could be predicted based on its holdings’ market risk, size (small is better), and value, which they defined as a stock having a high book value compared to its market value, i.e. P/B. (It’s worth noting that the Fama and French definition of value, which is what is constantly referred to in discussions of investment theory is far simpler than the definition of value that is used by current investors, who also include other metrics like price/sales, Price/earnings, Return on Investment, and Return on Assets. Price/Book can also be a misleading metric for stocks whose value is based heavily on intellectual property and other non-material assets. But I digress…
Fama and French’s Factor theory was based entirely on backtesting, but it impressed other academic economists enough that Fama and French won the Noble Prize of economics in 2013. However, since that time, the power of buying low P/B and small size companies’ stock to juice portfolio return did not live up to the hopes economists had, at least, it didn’t solve the problem of how to design perfect portfolios. Undaunted, Fama came up with more factors. One of them was volatility, with the theory being that lower volatility in a stock would lead to better long-term outcomes.
What is Volatility?
Volatility is defined as a statistical measure based on the dispersion of returns for a given security or market index from its mean. It is often measured as either the standard deviation or variance between returns from that same security or market index. In plain English, volatility tells you the extent to which a stock’s price has fluctuated above and below its average price over a given time period.
Note, however, that this is a backward-looking measurement. It is not possible to know how a stock’s price will fluctuate in the future, so volatility is only useful if you assume that stocks will continue to fluctuate the same way they have in the past.
A Very Short History of the Fad for Factor-Based Investing
Factor investing became a hot topic after Fama and French received their Nobel Prize. Several fund companies, most notable Dimensional Fund Advisors (DFA), came up with active mutual funds that claimed to be able to capture the so-called factor premiums for investors – for a price. The expense ratio of DFA’s factor funds was north of 0.50% until the competition from competitors forced them to lower them. In addition, investors couldn’t buy DFA funds directly but had to be clients of a professional investment advisor to be allowed to purchase them. This added another percent or two to their annual expense, but this exclusivity added to their appeal to wealthy investors.
These factor-based funds were popular enough that other fund companies eventually copied them and to be more competitive lowered the cost of entry. These funds and ETFs were actively managed, like DFA’s funds and claim to capture factors beyond the original three Fama and French factors, like momentum, Quality, Liquidity, and last but not least, Volatility.
It is the Volatility ETFs that are attracting renewed investor interest now that the market looks like it could be heading into some fairly choppy waters.
There are Two Kinds of Volatility Factor ETFs – Low Volatility and Minimum Volatility
Though the titles of these Volatility-oriented ETFs may make them sound like they should be similar investments, they are, in fact, very different. It is important to understand this difference before you invest in one.
Low Volatility ETFs
ETFs with the word “Low” in their title choose stocks each one of which meets some criteria that the ETF provider has decided is the proper way to define Low Volatility. So when you buy a Low Volatility ETF you should expect that every stock in the index has historically had a relatively calm stock price movement.
Minimum Volatility ETFs
In contrast, Minimum Volatility ETFs are designed with the idea that the volatility of the ETF as a whole will be minimal. Some of the individual stocks held by the ETF may have price histories that have low volatility, but others may not. The idea is that this mix will create a smooth, less volatile ETF price. Given the complexity of building such an index, these Minimal Volatility ETFs are actively managed ETFs, albeit ones that are actively managed using mostly quantitative measures. This means we are supposed to trust that the geniuses who manage the indexes have discovered some secret sauce that will allow them to combine a hundred or so stocks in a way that will produce the desired effect.
Because the formulas used to come up with the secret sauce are not public, these Minimum Volatility ETFs are very much like any actively managed mutual fund, in that the methodology used to construct the indexes they follow is opaque. Their history might tell you something about how they have performed in the past, but they don’t tell you how they select stocks, so you can’t really know how they will perform in markets different from those that they have been active in during their brief lifespans.
A Deeper Look at Two Minimum Volatility ETFs
The largest and oldest of the Minimum Volatility ETFs is the iShares MSCI USA Min Vol Factor ETF (USMV). “Oldest” is a relative term here as USMV only started trading in October of 2011. It manages $29.06 Billion in assets and has the longest history of any of the Volatility-focused ETFs. It offers the second-lowest expense ratio at 0.15%, which is considerably cheaper than the expense ratio of most typical Volatility Factor ETFs which tend to be near or above 0.25%.
How Does USMV Work?
Given that it has far more assets than others in its niche, we can conclude that USMV is the ETF that most investors choose when they seek to optimize the Low Volatility factor. The methodology used to create the index tracked by USMV is described in this document:
MCSI USA Minimum Volatility Index Methodology Highlights
| Optimization | MSCI’s market-leading Barra Global Equity Model (GEM2) | Account for Factor volatility and correlation. Comprehensive and robust risk measures |
| Weighting | Minimize index volatility subject to constraints | Ensure high investability and liquidity |
| Constraints |
* Stocks: Lower of 1.5% or 20x the cap-weight, with a minimum of 5bps *Style: -/+ 0.25 relative to Barra factor exposure of the parent index (except for Volatility) * Sectors: -/+5% or 3x relative to the parent index * Turnover: Maximum 10% one-way turnover per rebalance |
Stock weight cap ensures adequate capacity and replicability Style and Sector caps ensure no unintended exposure Turnover limit ensures low-cost replication |
If these highlights don’t mean much to you, you might find this summary from FactSet Analytics provided by ETF.com more helpful. Or not. We are definitely in the land of Secret Sauce here.
USMV offers a minimum-volatility portfolio of US stocks. The fund’s index uses an optimization algorithm to build a minimum variance portfolio, one that considers correlation between stocks rather than simply holding a basket of low-vol stocks. While USMV applies sector constraints in its optimizer, sector bets can be substantial, if unsurprising. The fund typically overweights defensive, dividend-paying sectors. USMV’s optimizer also aims to keep other risk factors market-like as it dials back on volatility. The ETF takes substantially less risk than the market portfolio as shown by low beta.
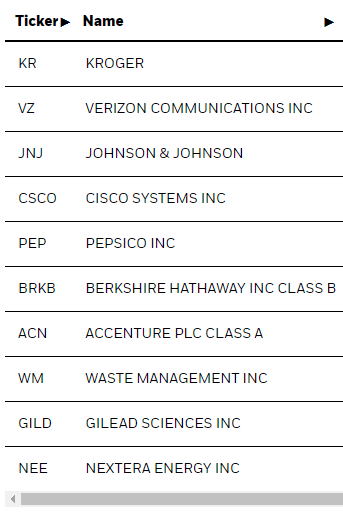
Now let’s take a look at USMV’s top holdings to see if that gives us a better feel for how it operates. It holds 172 US stocks selected from a total US stock market database.
The Top 10 Stocks in iShares MCSI USA Minimum Volatility Factor ETF
iShares
These top 10 stocks make up only 15% of the value of the entire ETF and the size of the holdings of each of these ten stocks is very similar, with the biggest holding, Kroger (KR) making up 1.63% of the whole and the last of the 10, NextEra Energy (NEE) making up 1.41%.
This tells us that USMV is not Market Cap weighted as Kroger’s market cap is far smaller than that of Johnson & Johnson. Its overall P/E ratio, iShares tells us is 31.23, which strikes me as very high for an investment that is supposed to protect against downturns. USMV tilts heavily toward the Tech sector, which makes up 24.02% of its total value and Health Care which makes up 17.73. The heavy tilt towards Tech probably explains the significantly higher P/E ratio of the entire ETF.
Minimum Volatility ETFs Differ From Each Other: VFMV for Example
For some perspective, let’s look now at another Minimum Volatility Factor ETF that makes claims similar to those of USMV, The Vanguard U.S. Minimum Volatility ETF (VFMV). This ETF has the lowest expense ratio of all the Volatility-focused ETFs I looked at, at 0.13%, but its $52.2 Million in assets is minute in comparison to USMV’s $29.06 Billion. It is also far younger than USMV, as it only started trading in February of 2018.
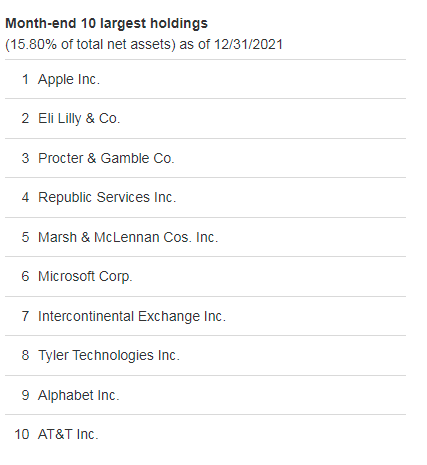
A quick look at its top holdings shows that while it holds many of the same stocks as USMV, it holds them in different percentages, sometimes very different. It holds 142 stocks, slightly lower than USMV’s 172.
Top 10 Stocks in Vanguard’s US Minimum Volatility ETF
Vanguard
This list suggests that Vanguard’s Minimum Volatility ETF is also not market cap Weighted, though it holds more of the top 10 stocks in the S&P 500 than does USMV. The top 10 stocks in Vanguard’s VFMV make up 15.8% of its total weight, not that different from USMV’s top 10 weightings, and tech stocks also represent its largest sector holding, making up 22.60% of its value, followed by Health care at 17.60%.
VFMV has a lower P/E ratio than USMV, at 25.6, but that P/E ratio is still quite high, which would be a factor to consider when thinking about how this ETF might perform in a market where the overall P/E ratio was correcting.
As far as its methodology is concerned, Vanguard tells us,
The fund invests primarily in U.S. common stocks that when combined in a portfolio minimize volatility relative to the broad market, as determined by the advisor. The portfolio will include a diverse mix of companies representing many different market sectors and industry groups. The advisor uses a quantitative model to evaluate all of the securities in an investment universe comprised of U.S. large, mid, and small capitalization stocks and to construct a U.S. equity portfolio that seeks to achieve exposure to securities with relatively strong recent performance subject to a set of reasonable constraints designed to foster portfolio diversification and liquidity.
We are again in “Shut up and trust me” territory here. Even with all this verbiage, I have no clue how VFMV’s portfolio is built.
What Comparing These Two Minimum Volatility ETFs Tells Us
As you can see, not a single one of the stocks in the list of top 10 holdings by weight of the iShares Minimum Volatility ETF appears in the top 10 holdings by weight of the Vanguard ETF. I downloaded the list of all stocks held in USMV and found that the rest of the stocks in Vanguard’s top 10 are held in USMV, but in smaller amounts. In one case, much smaller – VFMV’s top holding, Apple (AAPL) makes up only .30% by weight of USMV whereas it makes up 1.68% of VFMV.
What we seem to have here is some sophisticated, quantitative performance chasing.
The Performance Until Now of These Minimum Volatility ETFs
How good is that performance? It’s hard to tell as the point of Fama and French’s factor analysis is that factors are predictive over long stretches of time in the market and these ETFs have only been around for a decade at most.
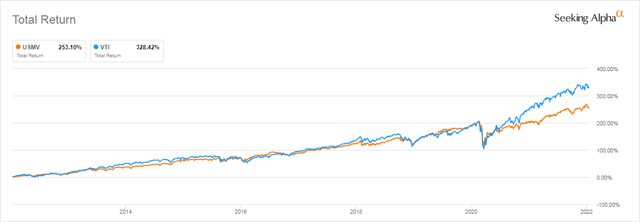
As these funds draw their holdings from a far larger set of stocks than does the S&P 500, I compare them to the Vanguard Total Stock Market ETF (VTI). Over the past decade when it has traded, USMV has lagged the performance of VTI by a significant margin, returning 253.10% compared to VTI’s 328.42%.
There have been, several periods during the past decade where USMV has outperformed. It has only been during the period in which the total market index surged after COVID-19 that the performance margin became very significant.
USMV Ten Year Performance Compared to VTI
Seeking Alpha
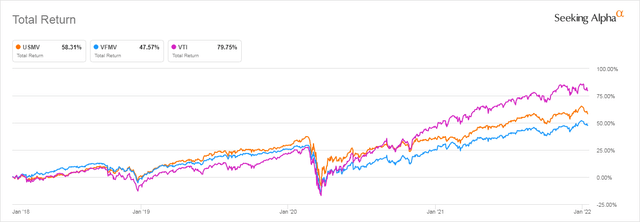
Comparing the performance of all three ETFs over the shorter lifespan of VFMV, and focusing on how they responded to the March 2020 Covid swoon we see this:
USMV and VFMV Performance since Feb 2018 Compared to VTI
Seeking Alpha
USMV had a brief period in 2018 where it outperformed VTI, but though it declined less than VTI did in March of 2020, it under-performed again as soon as the market as a whole began to recover.
I conclude from this brief analysis that USMV is the most popular Minimum Volatility ETF for good reason. It is not a terrible choice for investors seeking to protect themselves against sharp market declines.
USMV would be best held in a tax-advantaged account where it can be sold off when market recoveries get underway. It is not an optimum long-term buy-and-hold investment for a taxable account as selling it when the market starts to boom again could incur significant capital gains taxes if you had held it for more than a year or two.
Are Low Volatility ETFs Any More Consistently Designed?
Given that all the stocks in a Low Volatility ETF are supposed to have the characteristic of having low volatility, rather than the ETF as a whole, I originally thought it would be easier to get a feeling for how the class of Low Volatility ETFs could be expected to perform by doing a deeper analysis of the holdings of a few of these.
Boy, was I wrong!
It turns out that there are as many ways of defining “low volatility” as there are Low Volatility ETFs. Let’s take a quick look at several of these.
Dedicated Low Volatility ETFs
Invesco S&P 500 Low Volatility ETF (SPLV)
This ETF holds stocks selected from the S&P 500. The past 12-month volatility is used to determine a stock’s volatility. The prospectus tells us that,
The Underlying Index weights the 100 constituent securities based upon the inverse of each security’s volatility, with the least volatile securities receiving the greatest weights in the Underlying Index.
It currently has a lower Beta at .70 than the S&P 500 as a whole which is by definition 1.0.
The index SPLV follows is reconstituted quarterly. It has an expense ratio of 0.25%.
Looking at its top 10 stocks, I see several stocks I own in my dividend portfolio, which I chose based on the consistency of their earnings growth, Hershey (HSY), Procter & Gamble, and Colgate-Palmolive (CL). The others are also stocks that have shown up on my value screens over the years.
Note that there is little overlap with the top 10 stocks held in the Minimum Volatility ETFs we looked at above. Verizon (VZ) and Johnson & Johnson (JNJ) appear in USMV’s top 10 and Procter & Gamble in VFMV’s top10, but that’s it.
SPLV Top 10 Holdings by Weight

Seeking Alpha
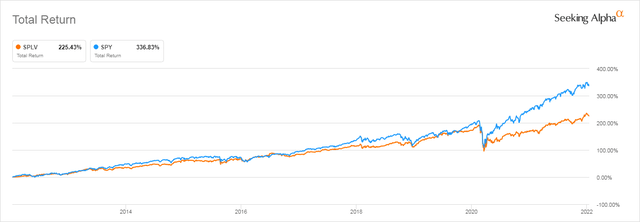
SPLV has underperformed its parent index, the SPDR S&P 500 ETF Trust (SPY) through much of its history, but that is a short history which only goes back to 2011 and thus is limited to the bull market. Since the reason why people are considering buying into Low Volatility ETFs is to benefit them during the onset of a bear market that record isn’t all that informative. As you can see, that history only tells us that SPLV is not the ETF you want to own in a bull market.
SPLV vs SPY 10 Year Total Return
Seeking Alpha
Fidelity Low Volatility Factor ETF (FDLO)
This ETF draws its stocks from a “1000 stock universe.” It currently holds 128 stocks. It determines which stocks have low volatility using the stocks’ five-year standard deviation of price returns, their five-year history of EPS, and their five-year history of beta. This is a capped market cap weighted index, which means there are limits on how much by weight that any one stock can contribute to the whole.
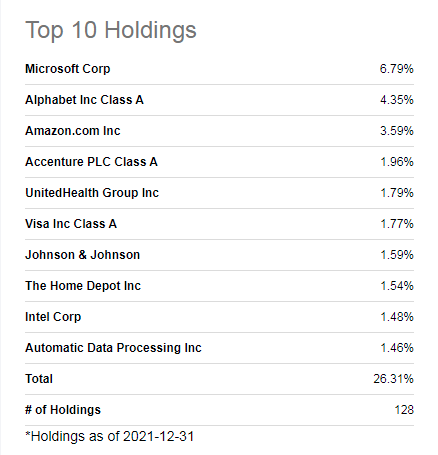
Since it draws from that larger “universe” of stocks to select from, this fund includes mid-cap stocks, unlike SPLV. But given that it is cap weighted, it isn’t going to be holding very much of those smaller stocks by weight. Its top 10 holdings by weight made up 26.31% of its total value at the end of 2021. And those top 10 stocks have a very familiar look to them.
Fidelity Low Volatility Factor ETF Top 10 Holdings
Seeking Alpha
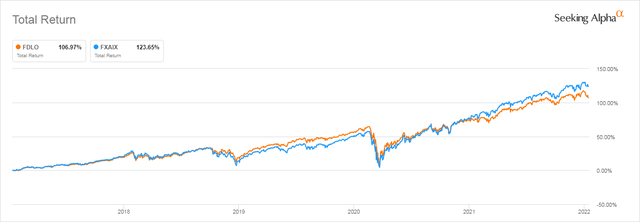
Those top 10 holdings look a lot like the top 10 holdings of the S&P 500. You are, however, paying a 0.29% ER to own them rather than the 0.015% you would pay were you to buy the Fidelity 500 Index Fund (FXAIX) or the 0.03 you’d pay for the Vanguard S&P 500 ETF (VOO). In return for that extra expense you are paying, you would have given up quite a bit of performance since the fund’s inception in 2016.
FDLO 5 Year Total Return Compared to FXAIX
Seeking Alpha
You have probably noticed that the performance gap between FDLO and FXIAX is nowhere as near as large as that between SPLV and SPY. This is not due to the longer time period used in the comparison as a five-year comparison of SPLV and SPY still shows us much more severe underperformance. SPLV returned 77.63% over the past five years while FXAIX returned 123.63%
The probable explanation for the difference is that FDLO is market cap weighted and, as we saw, is dominated by the same mega-cap stocks that are very much like those that dominated SPY, so it would perform more like SPY. FDLO just excludes some highly volatile stocks, like Tesla (TSLA) that contributed that last little edge to the S&P 500’s performance over the past two years.
High Dividend Low Volatility ETFs
Another approach to defensive low volatility investing has been to combine high dividend yield with low volatility. One major fund that does this is the Invesco S&P 500 High Dividend Low Volatility ETF (SPHD) which began trading at the end of October of 2013. It holds $3.18 Billion in assets, far less than SPLV. It has a higher expense ratio too, at 0.30%.
Here we find yet another completely different method of weighting Low Volatility stocks. SPHD selects the least volatile of 75 high dividend stocks in the S&P 500 and then weights them by dividend yield capping any sector’s weight to 25% of the whole.
Invesco tells us SPHD has a SEC yield of 3.84% and a trailing 12-month distribution rate of 3.36%. But that high dividend has been achieved at the expense of total return. SPHD’s five-year total return of only 43.69%, is far lower than SPY’s 123.63% and SPLV’s 77.63%.
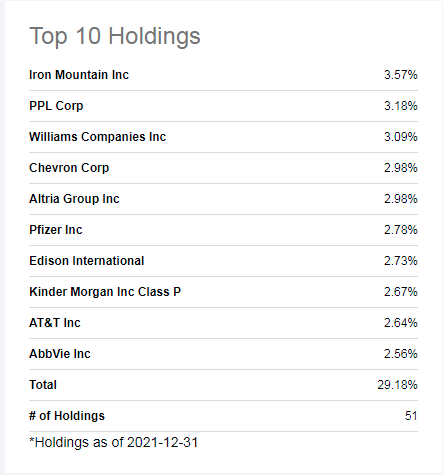
SPHD’s Top 10 Stocks by Weight Make Up 29% of Its Total Value
Seeking Alpha
This is definitely not the S&P 500’s lineup. It’s top holding, Iron Mountain (IRM) is a REIT. It also holds several stocks whose long-term relatively stagnant share price might be considered as “low volatility” like AT&T (T), Chevron (CVX), and Altria (MO).
A second ETF that combines Low Volatility with High Dividend yield is the Legg Mason Low Volatility High Dividend ETF (LVHD) which launched on the last day of 2016. It is smaller than the other ETFs we have looked at, with only $785 Million of assets under management.
LVHD takes yet a different approach to constructing a low volatility ETF. As explained by FactSet Analytics as reported by ETF.com.
LVHD explicitly aims for what it calls “stable yield”… Specifically, LVHD considers the volatility of prices and earnings in addition to yield and positive earnings. The fund culls a relative handful of names (roughly 50 to 100) from its broad parent index using this approach, and weights them in the same fashion, subject to constraints on concentration, turnover and liquidity.
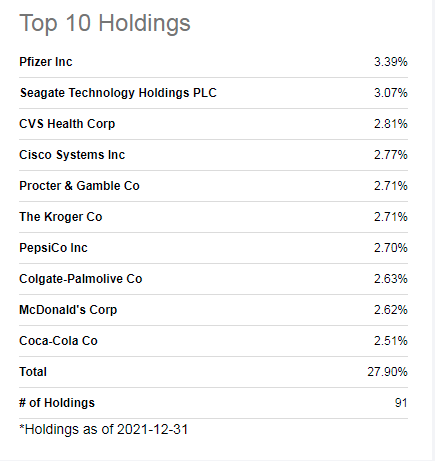
LVHD’s Top 10 Stocks Make Up 27.9% of Its Value
Seeking Alpha
Here we see holdings that look a lot more like SPLV’s, except for the large role assigned to Seagate Technology Holdings (STX).
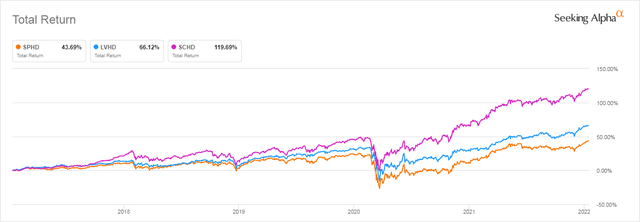
The addition of extra screening factors has not yielded impressive results so far. LVHD has out-performed SPHD but not SPLV over the past five years. And remember, total return includes the dividends these High Dividend/Low Volatility ETFs paid out.
Dividend-focused investors who invested in the Schwab U.S. Dividend Equity ETF (SCHD) earned a 119.69% total return over the same 5-year period, which dwarfs that of these low volatility dividend-focused ETFs.
SPHD and LVHD Total Return Since Inception Compared to SCHD
Seeking Alpha
Low Volatility Funds Targeting Different Markets
The funds we just looked at are largely invested in the US Large Cap market. Several other ETFs invest in Low Volatility stocks in other market segments, like Invesco S&P MidCap Low Volatility ETF (XMLV) which uses the same methodology as Invesco’s SPLV, but chooses its stocks from the Mid Cap S&P 400.
There are also quite a few International Minimum Volatility funds that use the more opaque active approach characteristic of these funds, like the iShares Edge MSCI Min. Vol. EAFE ETF (EFAV) which uses the same methodology as iShares’ USMV we mentioned above.
I could spend the rest of this article tracking down the details of all these various funds, but I think I’ve made my point, which is that each Low Volatility ETF you might consider takes a different approach to defining low volatility and to weighting the results it comes up, dragging in various other factors to come up with its unique mix. We are talking apples and oranges here, so you really can’t treat them as a class of investments.
Issues to Consider for All Low Volatility ETFs
There are however some issues that all investors should think through before investing in any of these, no matter what their unique strategy, or, in the case of the highly active Minimum Volatility ETFs, their secret methodologies.
The Volatility Factor is Always Looking Backwards
Volatility tells you how jumpy the price of a stock has been over some relatively short period defined by the ETF constructor. These ETFs are reconstituted at frequent intervals, ranging from every quarter to every year. That means that the stocks that no longer fit the Low Volatility parameters get tossed. But that means investors have held these once-low-volatile stocks for months while their prices suddenly start fluctuating far more strongly – for example over a sharp market decline.
Even though USMV did suffer less volatility in March of 2020, the other thing we have to remember is that the big Tech stocks that make up almost a quarter of its holdings stayed strong through that whole period. It might perform very differently in a bear market catalyzed by a different threat to the economy, like, for instance, sharply rising inflation and interest rates.
All These ETFs Have No History of Performance During a Sustained Bear Market
And that is the crux of the matter: It is a huge mistake to backtest how these ETFs performed during the few, month-long interruptions we have seen in the relentless rise of the S&P 500 since 2013. We have no idea now which of the many different strategies used to construct these ETFs will deliver what they promise.
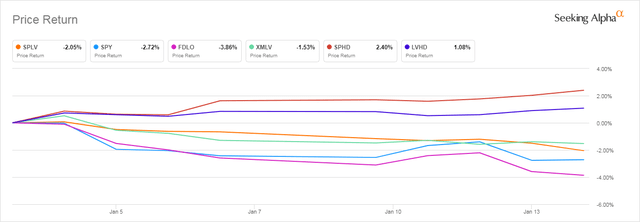
Given how different these strategies are, this is a huge issue. Observe the spread of returns of the ETFs we’ve discussed during the 2-week periods at the beginning of January 2022 when the market suddenly started to take seriously the idea that the Fed might stop feeding it money.
Low and Minimum Volatility ETF Price Performance Jan 1-17, 2022
Seeking Alpha
USMV has also underperformed the broad indexes between Jan 1, 2022 and January 14, 2022, dropping 3.51% over that period compared to VTI’s drop of 3.27% and Spy’s of 2.72%.
There is no consistency here, save that the two Low Volatility ETFs that weight stocks based on dividend yield rather than volatility or market cap were the only ones that didn’t suffer significant declines. Their performance was similar to that of other dividend-focused ETFs, SCHD is up 1.09% Year to Date, too. So the volatility factor probably wasn’t as important as picking good Dividend stocks was.
Of the ETFs that primarily chose stocks for volatility reasons, SPLV did just a bit more poorly than the S&P 500, XMLV did slightly better, and FDLO did much worse. USMV, despite its popularity, was one of the worst.
The Trend is Not Your Friend When That Trend is Consistent Overvaluation
We looked at Procter & Gamble’s P/E ratio history in the Fastgraph displayed at the beginning of this article. The extreme overvaluation it displays is also characteristic of many of the other stocks that play a large role in several of the Low Volatility ETFs we have looked at. A stock may have had a very steady, consistent price only because it benefited from being the focus of a temporary market fad, like dividend investing, or some other driver of momentum.
Procter & Gamble figures largely in several of these low volatility ETFs. So do many other stocks that have steadily seen their prices climb to levels that can’t possibly be justified by the rate at which they are growing their earnings. These stocks are very likely to become far more volatile than they have been for the past decade if the market corrects. So are the many extremely overvalued dividend stocks like Procter & Gamble whose EPS growth cannot be justified by their current P/E ratio or, for that matter, any other commonly applied valuation formula.
That 31.23 P/E ratio of the Minimum Volatility ETF, USMV, should raise the same alarms.
So there is something of a Catch-22 going on here. If the factors that have produced the momentum that has carried stocks like Apple (AAPL), Microsoft (MSFT), and Alphabet (GOOG) (GOOGL) to the top of several of these ETFs ends, and these stocks revert to their valuation, they will be a major cause of the tanking of the market as a whole, given the huge part they play in the total market’s performance until now. In that case, ETFs heavy in these stocks may do even worse than ETFs that hold a much larger, much more diversified basket of stocks, like SPY, VOO, or VTI.
On the other hand, if the prices of these stocks continue their relentless trek upwards, the Low Volatility ETFs will continue to underperform, because their quest for steady price action eliminates the stocks that experience the sudden, unexpected surges that lead to great gains. In that case, you’d be better off with, yes, a large, broadly diversified basket of stocks like SPY, VOO, or VTI.
Sometimes “Low Volatility” Means “Stagnant”
Stocks like AT&T that have seen their prices stagnate or decline slowly, but very consistently, over the past decade when most of the rest of the market kept surging are not likely to change their characteristics in a bear market. And again, here we also have a Catch-22. If AT&T’s price were to suddenly surge 20%, living up to all the fantasies that its investors have deluded themselves with for the past 20 years, it would no longer be a low volatility stock and would be removed from indexes that used low volatility to select stocks.
Bottom Line: Investing in Volatility ETFs is Not a Reliable Way of Protecting Your Portfolio
Volatility is too vaguely defined to be a useful factor for picking stocks. Indeed, these ETFs look like products the marketing departments of the various ETF providers came up with rather than a clever way for investors to protect themselves against the losses that will come with the next bear market.
Low Volatility ETFs only make sense in a bear market. But they can do so poorly in good markets that it is likely that investors who buy into them will miss the sudden recoveries that often follow bear markets. Then they will end up with a portfolio holding too many stagnant or grossly overvalued stocks.
The only way to protect yourself against a real, prolonged bear market is to never invest any money in any stock investment that you can’t let lie fallow for a period of 10-15 years during which its value may be as much as half of what you paid for it. If you are sitting on huge profits now thanks to the bull market we have been lucky enough to live through this past decade, take some profits off the table and set them aside so that you have money with which to buy whatever your preferred kind of investment is after the bear has set in.
[ad_2]
Source link Google News

