[ad_1]

Diego Thomazini/iStock via Getty Images
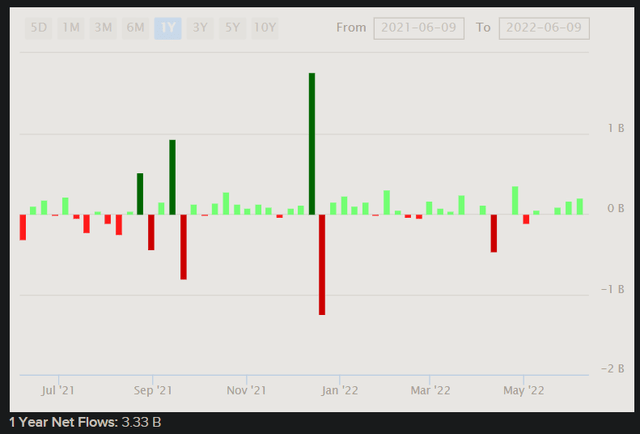
iShares Core S&P MidCap ETF (NYSEARCA:IJH) is an exchange-traded fund that offers direct exposure to mid-cap U.S. stocks. The expense ratio of this fund is favorable at just 0.05%, and this is perhaps in great part owing to the high popularity of the fund; net assets were $59.3 billion as of June 10, 2022. Net fund flows have been somewhat weak across some major funds recently; however, IJH has managed to coast along with net fund flows of circa $3.33 billion over the past year (illustrated below).

ETFDB.com
Over the past six months and three months, net fund flows have totaled $2.37 billion and $717 million, respectively. Even over the past month, IJH has netted positive fund flows of $504 million. So, while equity markets have been dropping recently, investors are continuing to back mid-caps. IJH was at one point 38.5% above its pre-pandemic high, and now it is only 13.5% above the same high (i.e., IJH is down over 18% from its most recent high set in November 2021).
IJH had 403 holdings as of June 9, 2022, making it rather diversified. The fund seeks to track the performance of its chosen benchmark, the S&P MidCap 400 Index. This index is constructed in a fairly straightforward fashion: all companies must be based in the United States with a market cap between $3.7 billion and $14.6 billion and have positive as-reported earnings over the most recent quarter and also on a trailing-twelve-months basis. There are a few other requirements for inclusion too, such as one based on adequate liquidity, but this is the crux of the index: 400 mid-cap constituents. IJH seeks to track the performance of this index, so the most recent fact sheet available on the S&P website can serve as a strong proxy for the underlying financials of the IJH portfolio at any given time.
As of May 31, 2022, IJH’s index reported trailing and forward price/earnings ratios of 20.48x and 12.86x, respectively, with a price/book ratio of 2.61x. The indicative dividend yield was 1.58%. That gives us a forward return on equity of just over 20%, indicating that IJH’s portfolio is productive in terms of earnings relative to net assets, in aggregate. I also trust S&P’s numbers more than certain other data providers like Morningstar that make certain earnings adjustments. Nevertheless, Morningstar, in this case, reports a forward price/earnings ratio of 12.96x (that is later, as of June 9, 2022) and a price/book ratio of 2.01x, for a forward return on equity of 15.5%. The difference is based on the price/book estimate; Fidelity and Yahoo! Finance report recent estimates for the price/book of 2.27x and 2.75x, respectively.
For the sake of simplicity and consistency, I will work with S&P’s price/book, however, it does not matter too much as we should focus on underlying earnings power primarily to gauge IJH’s value. The difference between the trailing and forward price/earnings ratios indicates a forward one-year jump in earnings. Morningstar estimates three- to five-year average earnings growth for IJH at 15.59%, but if that includes the first year, then the post-year-one average would be more like 4-5%, which is not unreasonable to project.
Assuming no buybacks and a constant dividend distribution rate, that would also require us to drop the return on equity if we want to assume earnings growth normalization over the next few years. If we did assume buybacks but held earnings growth rates constant, we could achieve a more stable return on equity. For the sake of conservativeness though, I will assume no buybacks, as these would enhance our projected IRR.
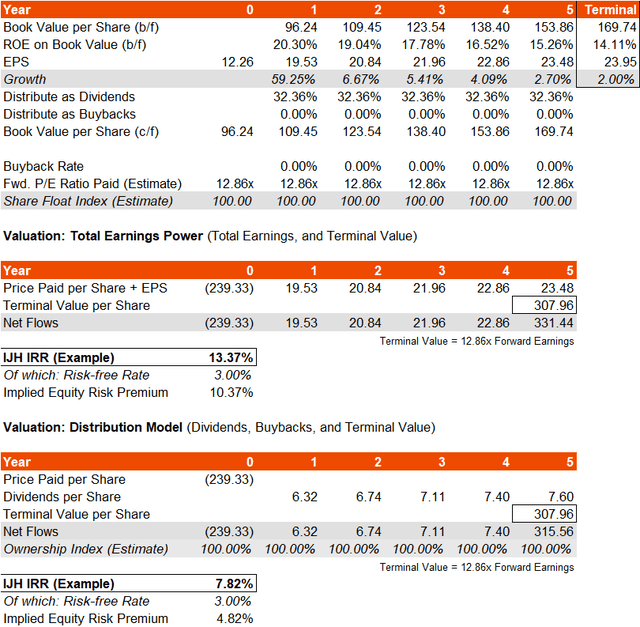
The results are below. On total underlying earnings power, IJH as a portfolio would seem to potentially offer a high IRR of over 13%, which would imply a 10% equity risk premium over a risk-free rate of 3%. That is high, given that IJH is fairly diversified, making the fund’s beta only about 1.11x over the past five years (only modestly more volatile than the S&P 500).

Author’s Calculations
Even on a distribution model that assumes no buybacks, IJH’s possible ERP is circa 5%, which is healthy. It seems like analyst estimates of forward earnings are higher than the market is predicting, so there is some doubt here and therefore a fairly high equity risk premium embedded in the valuation of the fund. This is reflected in the low forward price/earnings ratio of 12.86x; with a risk-free rate of 3%, that implies a forward equity risk premium proxy of 6.78% with a terminal earnings growth rate of “just” 2%. Arguably, the price/earnings multiple should be at least 16-17x, which would give you a 5% equity risk premium, a 3% risk-free rate component, and a 2% terminal growth rate (valuing IJH’s forward earnings in the same way you might when using a dividend discount model).
I think IJH is quite clearly undervalued, at least, if we trust in consensus analyst estimates. Therefore, I think recent net inflows are justified. Mid-caps are likely to be less well covered by analysts in aggregate, and they are smaller and less understood in general, and so that would explain a higher equity risk premium, also unsurprising on such a large mid-cap portfolio. Still, upside on valuation of over 24% as a minimum (provided IJH’s portfolio delivers on earnings expectations) over the next twelve months I think is more than achievable. If one were to hold the fund over five years or so, assuming this valuation uplift too, one’s IRR might hit the 12-17% range, which I think makes IJH attractive and possibly a good supplement to a portfolio that contains large-cap exposures too.
[ad_2]
Source links Google News

