[ad_1]
aprott/iStock via Getty Images
Every year the topic of “green” energy is becoming more and more relevant in the world. The fight against climate change, as well as the energy crisis, is forcing almost all the largest economies in the world to think about reducing the share of fossil fuels in the energy balance in favor of renewable energy sources. The iShares Global Clean Energy ETF (NASDAQ:ICLN) contains alternative energy companies and provide the opportunity to participate in the development of one of the most rapidly growing industry in the world.
About The ETF
iShares Global Clean Energy is the ETF by BlackRock aimed at investing in shares of the increasingly popular alternative energy. Technically, the fund follows the structure and dynamics of the S&P Global Clean Energy index. The index covers mainly solar, wind, hydrogen, geothermal and biofuel energy. Both companies directly engaged in electricity generation and manufacturers of various equipment for them are considered. The fund has $4.42 billion in AUM.
The criterion for including companies in the fund is a capitalization of at least $300 million, a free-float capitalization of more than $100 million and a listing on a developed market exchange.
- The companies have to get at least 25% of revenue from the direction of clean energy, generate more than 20% of energy using renewable energy sources or are included in the renewable energy sector, according to the GICS classification.
- The companies are excluded if they have too high an emissions-to-revenue ratio or generate a significant amount of revenue from activities that are contrary to the principles of sustainable development: tobacco, alcohol, weapons, thermal coal, oil sands, etc.
- Each of the remaining companies is assigned a green energy dependency parameter value, which may be 0; 0.5; 0.75 or 1. The value of the parameter is determined by the share of generation from renewable energy sources or revenue from the direction of clean energy. Only companies with this parameter greater than zero can get into the index.
- In total, there can be no more than 100 stocks in the index and their weighted average value of the dependence parameter on green energy must be more than 0.85.
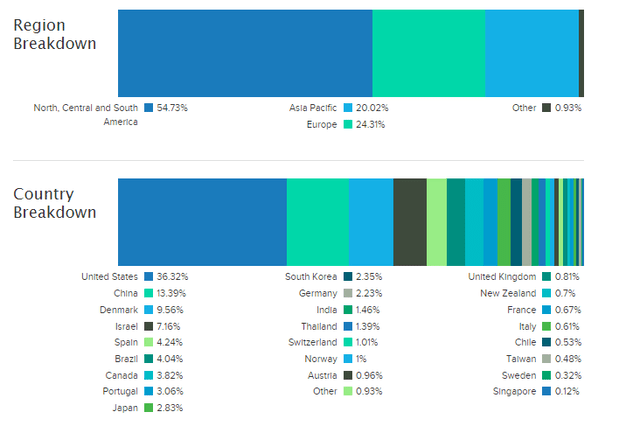
Due to this index formation methodology, the ETF mainly includes companies involved in the electric power industry, renewable energy sources and semiconductor equipment. Geographically, the largest share is expectedly occupied by developed Western countries, where the topic of reducing emissions and switching to renewable energy is the most relevant.
Growth Factors
The biggest long-term source of growth for green energy companies is the massive plans of the largest countries to achieve carbon neutrality in the next 30-40 years, which began to be voiced after the conclusion of the Paris Agreement aimed at curbing global warming. For example, the EU and the US plan to achieve this by 2050, even China has plans for carbon neutrality until 2060. One of the most effective ways to reduce emissions is to switch from fossil energy sources (coal, gas, oil) to renewable ones (solar, wind, “green” hydrogen).
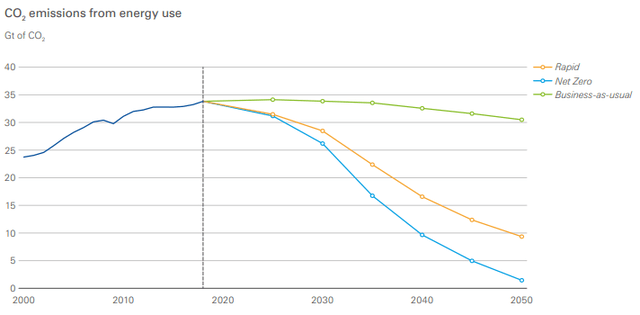
At the same time, it is impossible to say unequivocally what will happen in the world as a whole in 30 years, in connection with which most forecasts are of a scenario nature. For example, BP presents three possible scenarios for the development of mankind, which primarily differ in the rate of emission reduction: Net Zero, Rapid and Business-as-usual.
BP
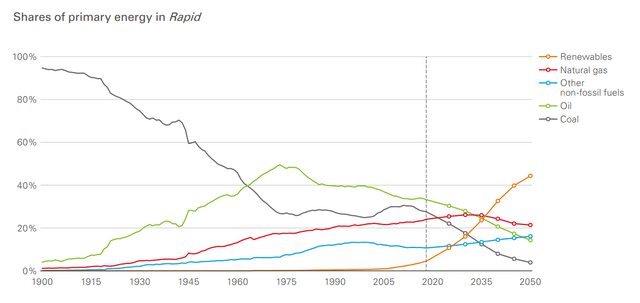
In the two most “green” scenarios, the share of renewable sources of energy (which primarily includes solar and wind energy) in the global energy balance by 2050 may reach 45-60%. At the same time, according to BP’s forecast, active growth will begin in the coming years, and by 2030 the share of renewable energy in the energy balance may reach 20%.
BP
Looking at the shorter term, there are already significant sources of growth for the alternative energy industry. Europe is, of course, developing most actively in this direction. The so-called “European Green Deal” to combat carbon dioxide emissions, among other things, involves an increase in the share of renewable energy in the energy mix to 40% by 2030, which corresponds to an approximately two-fold increase. In addition, the EU has a carbon credit trading system that encourages a shift away from fossil fuels. For some enterprises, an emission quota is set, the excess of which must be paid for by purchasing carbon credits.
Another important driver for the entire alternative energy industry was the election of the well-known climate change advocate Joe Biden to the US presidency. Last year, the head of the United States proposed a $1.75 trillion spending plan, $555 million of which is planned to be spent on the development of renewable energy, electric vehicles and the fight against global warming. The largest component of this plan is the expansion of tax incentives for the use of renewable energy – $ 320 billion is planned to be allocated for this. In addition, $ 110 billion will go directly to grants, loans, purchases and incentives for the use of alternative energy sources in various industries. I believe that in the future the Biden administration will continue to actively develop “green” energy in the United States, which will be medium-term support for the industry.
A key risk for ETFs is the reluctance of some countries to actively pursue an energy transition due to the impossibility or disadvantage of moving away from fossil fuels too quickly. In addition, renewable energy’s big problem is dependence on external factors and difficulties with energy storage systems.
Top Holdings
As of 05/18/22:
| Name | Ticker | Weight | Country |
| Enphase Energy | ENPH | 7.30% | US |
| Consolidated Edison | ED | 6.92% | US |
| SolarEdge Technologies | SEDG | 6.64% | US |
| Vestas Wind Systems | OTCPK:VWSYF | 5.56% | Denmark |
| Plug Power | PLUG | 4.36% | US |
The five largest ETF assets are distributed between solar (Enphase Energy, SolarEdge Technologies), wind (Vestas Wind Systems) and hydrogen (Plug Power) energy and utility (Consolidated Edison).
etfbd.com
Solar Energy
Enphase Energy is an American company that develops and implements energy solutions for the home generation of electricity based on solar energy. The feature of Enphase Energy technology is the use of micro-inverters, which immediately convert the direct current generated by a single solar panel into alternating current. A key advantage of using microinverters is the independence of solar panels, which reduces the negative effect of local dimming, snow cover or breakage of one of the panels. SolarEdge has a similar business model to Enphase Energy. SolarEdge products can be daisy-chained, which are then connected separately to the inverter. This saves money for installation as it does not require the purchase of multiple microinverters.
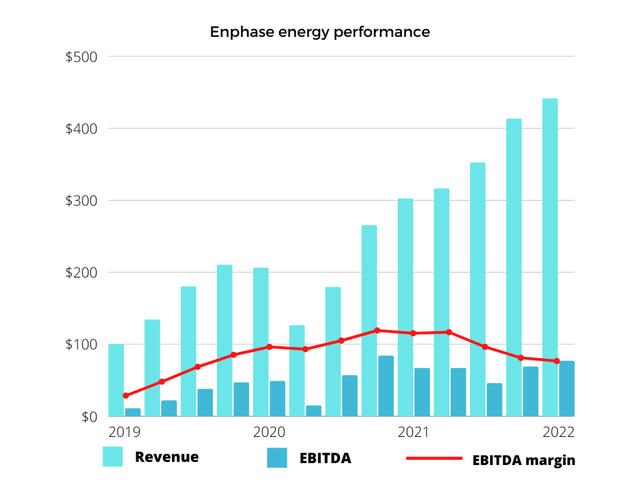
chart by author
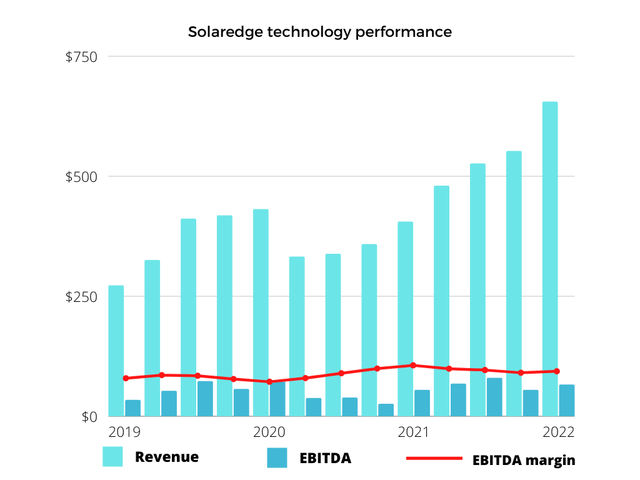
chart by author
Enphase Energy and SolarEdge are one of the largest holdings in ICLN. They are one of the largest players in the industry with high growth rates, whose business is inextricably linked to the future of global energy. The scale advantage and geographical expansion make the 13.94% weight of these two companies look appropriate.
Wind Energy
Vestas Wind Systems is a Danish company, the world’s largest supplier of wind turbines, with a market share of about 15%. Vestas is engaged in the maintenance of wind turbines – 18% of revenue.
In the coming years, Vestas, according to consensus expectations, will moderately increase its key financial results. The key positive trigger for this is the steadily growing demand for wind turbines against the backdrop of the energy transformation of Europe. Restraining factors are the increase in prices for raw materials that occurred after the coronavirus crisis, as well as the prices for the company’s products that have been declining in recent years due to increased competition and the development of technologies in this area. At the same time, I believe that the current energy crisis in Europe could lead to an accelerated energy transition and an increase in Vestas’ financial results forecasts in the medium term. The company accounts for 5.5% of all the ETF holdings, which makes it the biggest wind energy company in the portfolio. Vestas is a reliable company with a big market share. Its position in the ETF is surely justified.
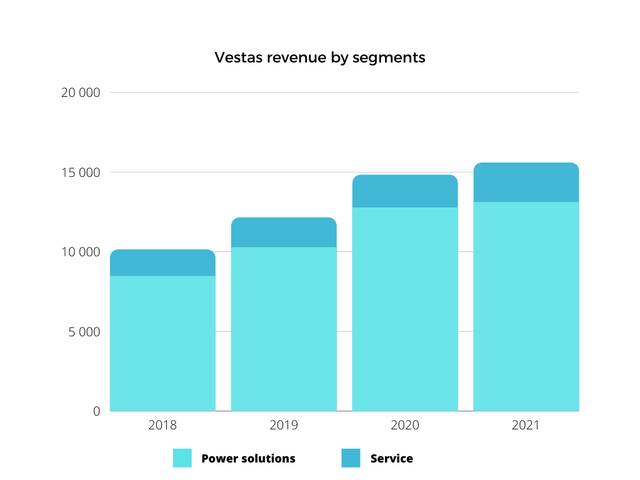
chart by author
Hydrogen Energy
Plug Power is an American company developing hydrogen fuel cell systems that replace conventional batteries in electrically powered equipment and vehicles. A hydrogen fuel cell uses only hydrogen and oxygen, and the emissions in this case are heat and water, which makes it completely environmentally friendly.
At the moment, the key industry generating Plug Power’s revenue is material handling, which accounted for 94% of total revenue in 2021. This segment solves the main current problem of hydrogen energy – the lack of appropriate infrastructure. Loading and unloading operations are usually geographically localized and can be managed with a limited amount of infrastructure.
In the future, Plug Power plans to develop in other directions, the key ones are the production of “green” hydrogen, as well as the introduction of its technologies to the electric vehicle market. The company plans to increase revenue to $3 billion by 2025 against $0.5 billion in 2021. Plug Power is expected to produce about 500 tons of hydrogen per day by 2025.
Plug Power looks like a company that could benefit in a big way from the rapidly growing hydrogen fuel cell market. But the future remains uncertain. The company is in big losses and there is a long way to the profitability. I think that given the risks and massive opportunities, it’s important that a company like Plug doesn’t account for more than 5% of all holdings. Plug Power’s weight in the ETF is 4.17%.
Utility
Consolidated Edison is an American utility company. The company is focused on regulated power, gas and steam transmission and distribution services, associated infrastructure maintenance operations and sustainable power generation projects
Since 2017, the installed capacity of renewable energy managed by Consolidated Edison has increased from 1.36 to 3.06 GW, and the output from them has increased from 3.15 GWh to 7.52 GWh. Most of the stations are managed by the Clean Energy Businesses segment, which sells electricity to the wholesale market. Con Edison buys most of the electricity sold at regulated tariffs on the open market. The entire electricity mix in the networks of the regulated divisions of CECONY and O&R is determined by the New York system operator, and the company itself is deprived of control over it.
Under such conditions, the main areas of development for Con Edison in the coming years will be the network infrastructure and non-tariff supplies of electricity from renewable energy sources to the wholesale market. The goal of 100% carbon-neutral electricity in the mix of own generation by 2040, taking into account the current power balance, also looks quite feasible. Given the current capacity, I believe that the company will be able to achieve carbon neutrality by 2040. The company itself has repeatedly said that it is considering “strategic alternatives” regarding the Clean Energy Businesses unit and may talk about its possible spin-off since such moves are not uncommon in the US utility market.
Consolidated Edison is a safe dividend stock. It is a classic utility company with not much room left for growth from its core business, but with big opportunities in the clean energy sector. The company’s weight in the ETF is 6.92% – it is a very safe play.
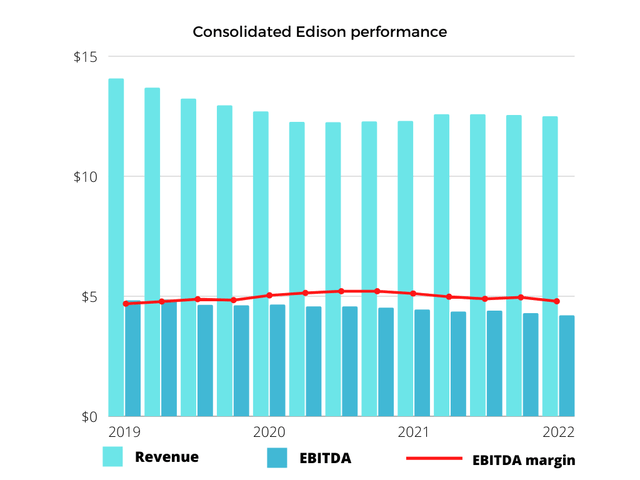
chart by author
Closest Peer
First Trust NASDAQ Clean Edge Green Energy Index ETF (NASDAQ:QCLN) is the main alternative to ICLN since it has $2.15 billion in AUM while others don’t even have $1 billion.
| ICLN | QCLN | |
| Dividend yield | 1.38% | 0.01% |
| Expense ratio | 0.46% | 0.58% |
| AUM | $4.75 billion | $2.15 billion |
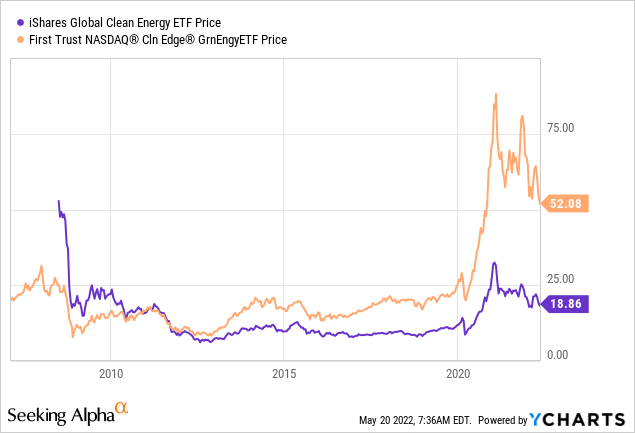
QCLN has massively outperformed ICLN in the past 12 years. While ICLN is trading near 2010 levels, QCLN has gained 233%.
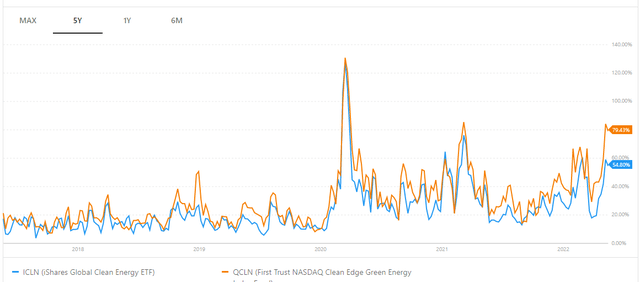
ICLN vs QCLN volatility – 54.80% vs 79.43% respectively.
portfoilioslab
ICLN looks like a bad choice due to its poor performance over the last 12 years. However, we should look forward, not to the past. The thing is that QCLN has lots of growth highly valued companies, which are generally related to green energy, but don’t directly make money from the energy itself. Take Tesla (NASDAQ:TSLA), for example. The company is very popular among ESG investors but certain non-sector-related risks make it impossible to look at QCLN as a renewable energy ETF. Besides, while QCLN focuses only on US stocks, ICLN has a great geographical expansion.
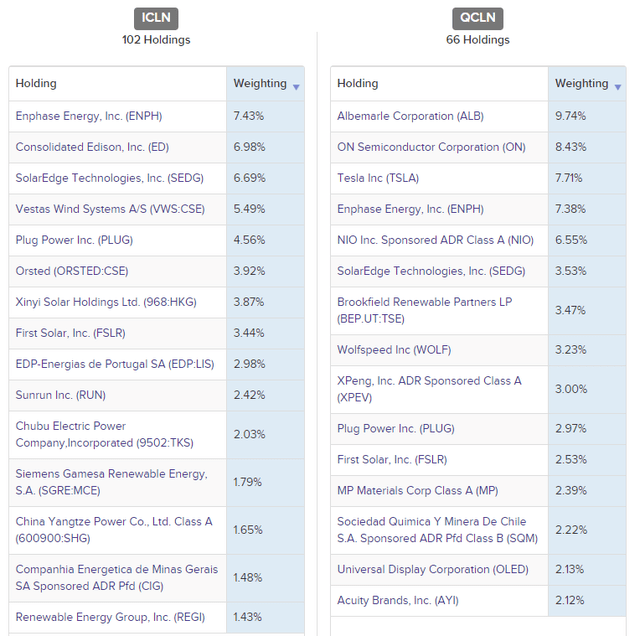
ICLN vs QCLN (etfbd.com)
I think that ICLN is a better way to capitalize on the rapidly growing renewable energy market since the companies in this ETF make money directly from energy. Still, QCLN has a more significant upside potential due to the large allocation of classic NASDAQ growth stocks.
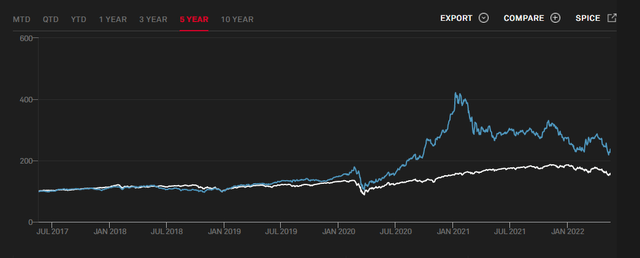
Performance
S&P Global
Conclusion
The iShares Global Clean Energy ETF provides the opportunity to invest in a range of green energy companies. I believe that the share of renewable energy sources will continue to grow and will be able to surpass the world share of coal plants in terms of actual electricity generation. The green energy market is poised for future growth. The popularity of green energy around the world is growing rapidly and thanks to such a rapid decrease in the cost of its production, “alternatives” are already beginning to step on the heels of traditional energy.
The iShares Global Clean Energy ETF has many promising companies. A key advantage of the ICLN is its global diversification, which allows both to balance risks and receive increased income from the growth of shares of representatives of the alternative energy sector, trading in the Chinese and New Zealand markets, which now account for 40% of total renewable capacity.
I assign ICLN a buy rating.
[ad_2]
Source links Google News

