[ad_1]

Eoneren/E+ via Getty Images
The Health Care Sector SPDR (XLV) holds the S&P 500 components that are in the healthcare sector. The allocation to each stock is a modified market cap weighting. Over the past 12 months, XLV has returned a total of 14.96%, as compared to 11.86% for the S&P 500 (SPY). Over the past 10- and 15-year periods, XLV has also had a higher annualized total return than the S&P 500.
|
1 Year |
3 Years |
5 Years |
10 Years |
15 Years |
|
|
XLV |
14.96% |
13.68% |
13.21% |
15.44% |
11.35% |
|
SPY |
11.86% |
17.24% |
14.38% |
14.22% |
9.89% |
Total return for XLV vs. SPY. Returns for periods longer than 1 year are annualized (Source: Morningstar)
These results are especially notable because XLV has a trailing 10-year beta of 0.84 vs. the S&P 500. The higher return over the 10-year period corresponds to alpha of 3.3% per year because of the (relatively) low beta. Because many healthcare stocks tend to be in the value category, one might suspect that the higher return is associated with an overall value tilt. Performing a 3-factor analysis (Fama-French), however, yields an alpha of 2.99% per year over this same 10-year period, suggesting that only a small part of the apparent outperformance can be attributed to the value tilt.
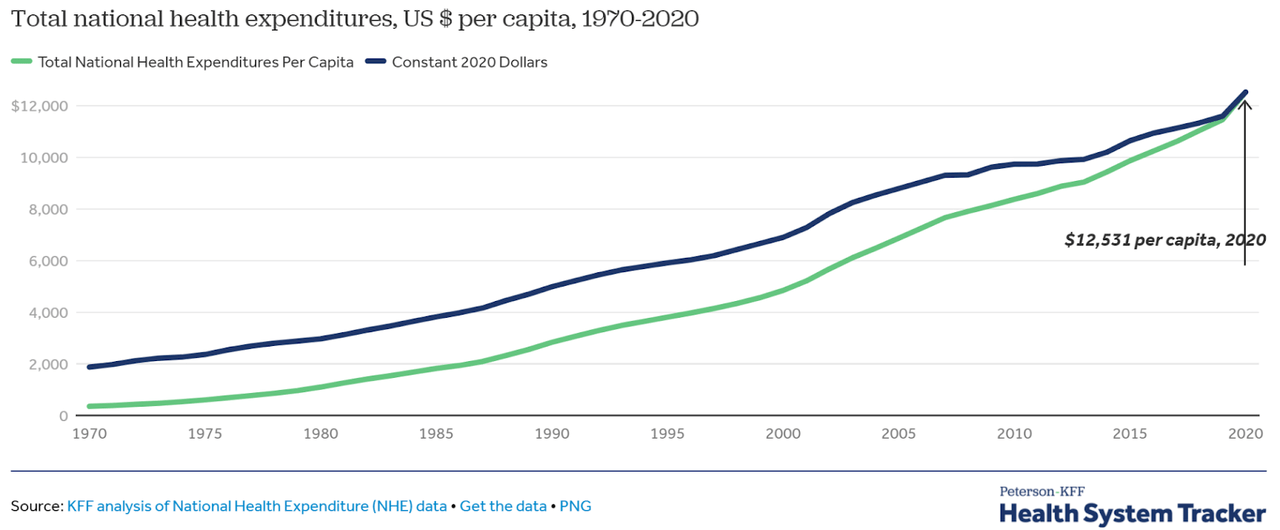
The explanation for the strong returns from healthcare stocks certainly starts with the inflation-adjusted increase in spending. In 2020, per capita healthcare costs exceeded $12,500 per person. Healthcare spending consumes a growing percentage of GDP as well, going from 12.1% of GDP in 1990 to 13.3% in 2000, 17.2% in 2010, and 19.7% in 2020. The 2020 figures are biased by spending related to COVID, of course.
Peterson-KFF
U.S. per capita healthcare spending over time (Source: Peterson-KFF)
With the graying of America, growth in demand for healthcare is essentially inevitable, so it is very hard to envision a reduction in national healthcare costs. Similarly, because older people tend to be more likely to vote, we are unlikely to see government policies that constrain consumption of healthcare resources.
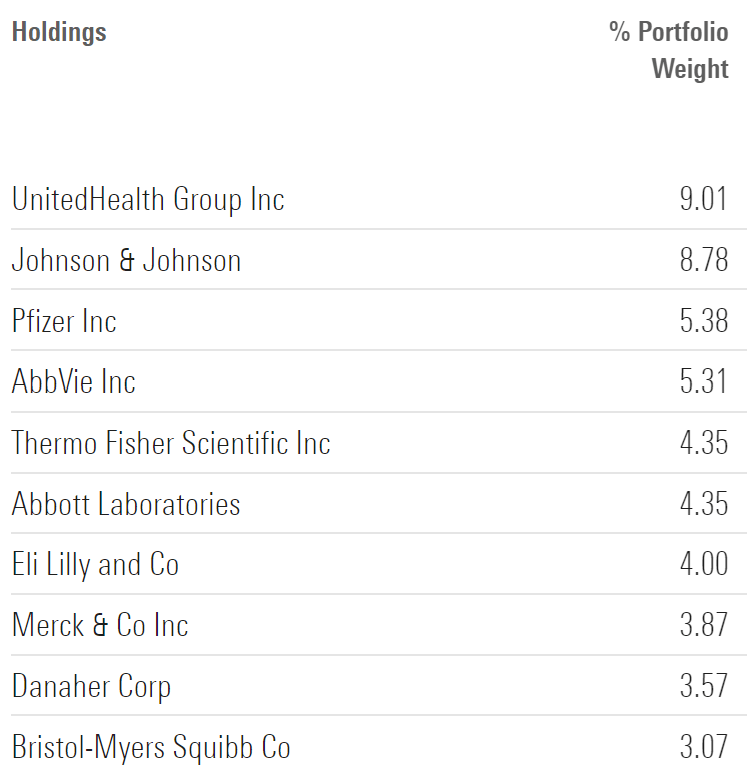
Selecting only stocks from the S&P 500 and allocating on a market cap basis means that the top holdings of XLV are all household names. While most of XLV’s top 10 holdings are drug companies, the largest single holding is United Health (UNH). For readers who may be interested, I have analyzed many of these stocks on an individual basis (UNH on February 24th, for example).
Morningstar
XLV top holdings (Source: Morningstar)
Market-Implied Outlook for XLV
To form a view on XLV, I look at a type of consensus outlook calculated from the prices of options on this ETF. The price of an option on XLV reflects the market’s consensus estimate of the probability that the share price will rise above (call option) or fall below (put option) a specific level (the option strike price) between now and when the option expires. By analyzing the prices of call and put options at a range of strike prices, all with the same expiration date, it is possible to calculate a probabilistic price forecast for XLV that reconciles the option prices. This is called the market-implied outlook and represents the aggregated consensus view among buyers and sellers of options on XLV.
I have calculated the market-implied outlook for XLV for the 3.5-month period from now until June 17, 2022 and for the 10.6-month period from now until January 20, 2023, using options that expire on these two dates. I chose these expiration dates to provide outlooks to around the middle of 2022 and through the full year, specifically selecting expiration dates for which there is more option trading volume. Options that expire in June and January tend to be active compared to other months.
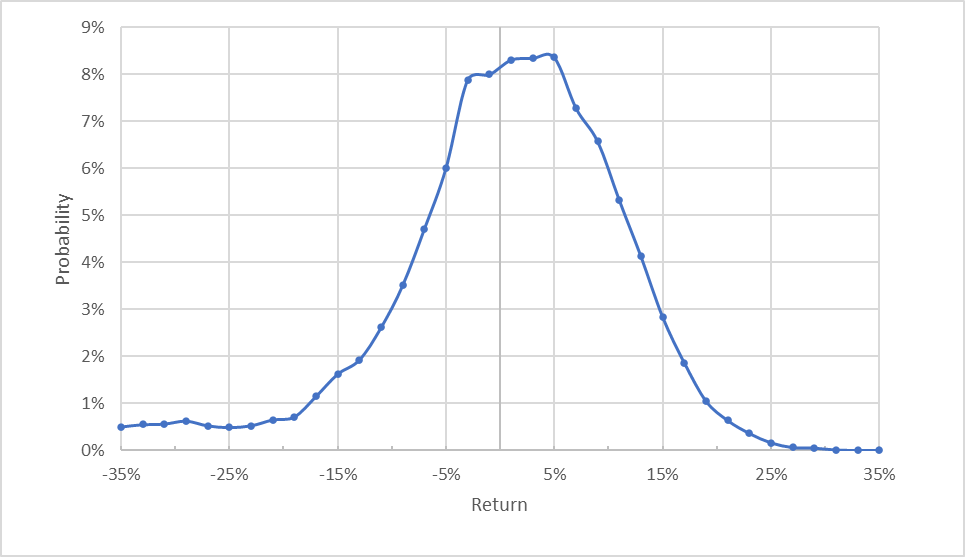
The standard presentation of the market-implied outlook is a probability distribution of price return, with probability on the vertical axis and return on the horizontal.
Geoff Considine
Market-implied price return probabilities for XLV for the 3.5-month period from now until June 17, 2022 (Source: Author’s calculations using options quotes from ETrade)
The market-implied outlook for XLV to June 17th has a fairly wide peak, and the maximum probability corresponds to a price return of 4.9% for the next 3.5 months. The outlook also has a long negative tail, meaning that the market is willing to pay a premium for put options that protect against losses. In statistical terms, this outlook is negatively skewed. The most-probable outcomes are positive returns, but the potential maximum losses are higher than the potential maximum gains. These properties are what we expect for a portfolio that is fairly diversified. The equity risk premium provides gains most of the time, in return for which investors bear the risk of large low-probability losses. The volatility calculated from this outlook for the 3.5-month period is 12% (annualized volatility of 22.2%).
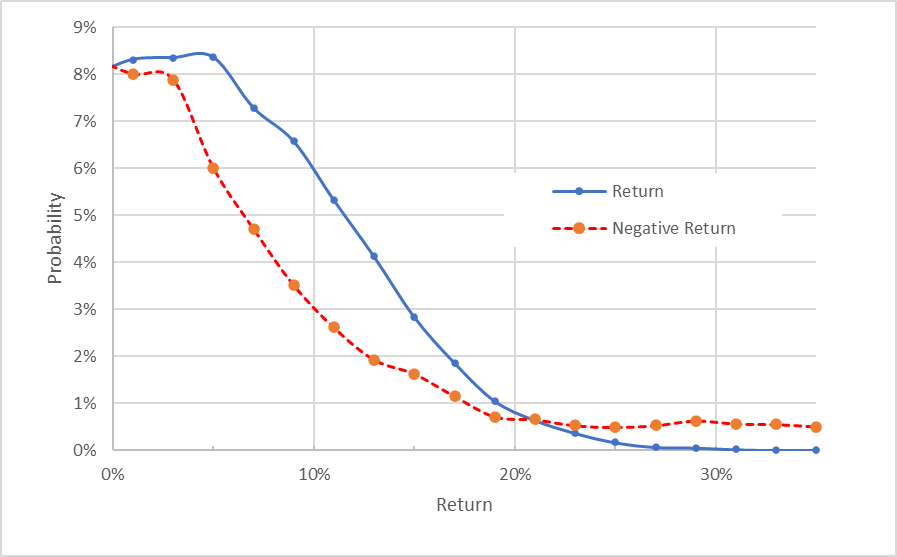
To make it easier to directly compare the probabilities of positive and negative returns of the same size, I rotate the negative return side of the distribution around the vertical axis (see chart below).
Geoff Considine
Market-implied price return probabilities for XLV for the 3.5-month period from now until June 17, 2022. The negative return side of the distribution has been rotated about the vertical axis (Source: Author’s calculations using options quotes from ETrade)
This view shows that the probabilities of positive returns are substantially higher than for negative returns of the same size over a wide range of the most-probable outcomes (the solid blue line is well above the dashed red line over the left ½ of the chart above). The probabilities of large-magnitude negative returns are higher than for positive returns of the same size (the dashed red line is above the solid blue line on the right ⅓+ of the chart), but these outcomes occur with a low overall probability.
This is a bullish outlook for XLV for the next 3.5 months.
The market-implied outlook for the 10.6-month period between now and January 20, 2023 is qualitatively similar to the shorter period, although the 10.6-month period looks more bullish. The peak probability corresponds to a price return of 6.5% and the volatility for this period is 20% (annualized volatility of 21.2%).
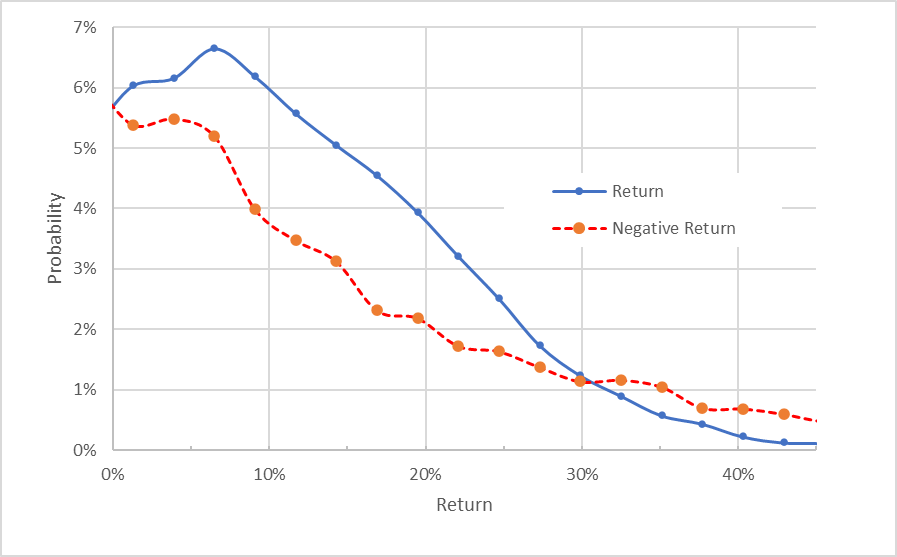
Geoff Considine
Market-implied price return probabilities for XLV for the 10.6-month period from now until January 20, 2023. The negative return side of the distribution has been rotated about the vertical axis (Source: Author’s calculations using options quotes from ETrade)
As a simple measure of most-probable return relative to risk, I look at the ratio of the peak-probability return with the standard deviation. For the 3.5-month period, this ratio is 41% (4.9% / 12%). For the 10.6-month period, this ratio is 33% (6.5% / 20%). These ratios are slightly higher than what I calculated for the Technology Sector SPDR in early February but lower than I tend to see for more-diversified index ETFs.
The market-implied outlooks to the middle of 2022 and to early 2023 look reasonable and indicate that the consensus view among buyers and sellers of options is that XLV presents a reasonable risk-return value proposition. The expected volatility, at about 21.5% (annualized), is somewhat higher than the trailing annualized volatility (15.6% and 14.7% for the 3- and 5-year periods, respectively). ETrade calculates 20% annualized implied volatility for the options expiring in January of 2023 (Source: ETrade.com), corroborating the higher-volatility outlook.
Summary
Healthcare stocks in the S&P 500 have outperformed for a long time, especially on a beta-adjusted basis. The narrative supporting the strong growth for this sector is straightforward. The U.S. population is aging and older people tend to consume more healthcare. It is hard for me to envision a likely scenario in which this growth disappears. Healthcare stocks, with some notable exceptions such as MRNA, have also been less impacted than other sectors by the speculative furor in recent years. This, in turn, means that there are fewer healthcare companies with the stunningly optimistic valuations that require perfect execution to justify. There are challenges facing the healthcare industry in the coming years, of course, and many will involve constraints on product pricing. Reducing the costs of pharmaceuticals is an issue with bipartisan support. The market-implied outlook for XLV is modestly bullish, but the expected volatility over the next year is higher than the historical volatility. The market-implied outlook seems consistent with the general narrative for healthcare stocks: generally positive outlook with higher risks than in recent years. I am assigning a bullish overall rating for XLV.
[ad_2]
Source links Google News

