[ad_1]
yangphoto/E+ via Getty Images
Introduction
A bit less than a year ago, I published an article concerning the Global Clean Energy Index ETF (ICLN) suggesting that investors would be buying into extreme valuations across the board and that the ETF wasn’t attractive despite having come significantly down from its peak at $32.5 to $22.7 at that point in time. The ICLN has delivered -16% returns since then, while the S&P 500 returned 16.85% meanwhile. I’ve also covered both Invesco Solar Portfolio ETF (TAN) and First Trust Global Wind Energy ETF (FAN) during the same time, having been skeptic of the valuations, especially for the solar companies who was trading at very high price to sales ratios. As such, one of the positives about ICLN has been its diversification across green energy.
The top ten holdings at that time traded with an average P/S ratio of 12.8 and an average price earnings ratio of 39.3 suggesting significant overvaluation, especially considering average 3-year growth was fluctuating wildly and often from low numerical levels.
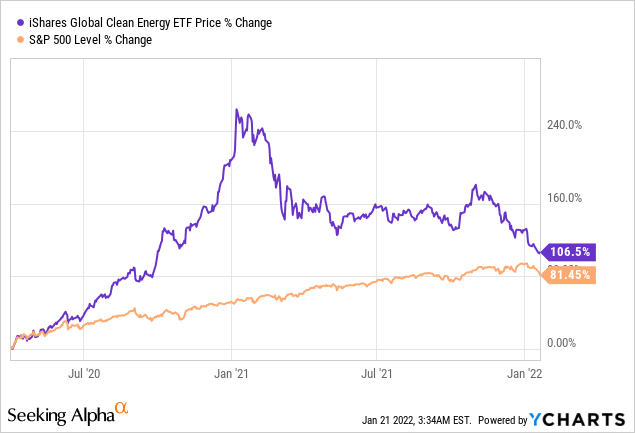
ICLN really took off in the wake of the COVID-19 market crash and despite trading sideways the last year, it is still outperforming the S&P 500 since then, albeit moving closer to equal performance than at any other point in time since the summer of 2020.
Some of my criticism could be argued is outdated as ICLN was remodelled to contain more than 80 holdings compared to the 30 at the point in time when I published my article. On top came the first United Nations Climate Change Conference since the onset of COVID-19, known as COP26, and hosted by the United Kingdom during November 2021, which must be acknowledged as a major event and a potential trigger for the ICLN holdings. An event that can typically be a catalyst due to countries revealing ambitious new targets and pledging massive budgets in the direction of clean energy, which is what the ICLN consists of. I had high expectations for that event, especially given that it would be the first annual conference for Joe Biden who had the chance to correct the previous administrations politics combined with the heightened sense of urgency amongst the general population on a global scale.
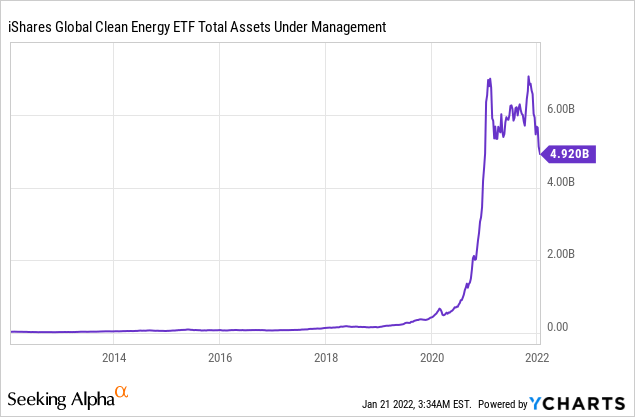
However, it would seem that ICLN and its holdings doesn’t command the same headline power at this point in time as very evident by the previous surge of inflowing capital, only for it to stop abruptly before finally receding to the lowest level since 2020.
All of this while we can’t deny the transformation towards a greener future is going full speed ahead.
The COP26 as an event provided conflicting statements causing some difficulty in asserting whether it was a success or failure. Fossil fuels were mentioned in the final protocol, but last-minute politics kept the more ambitious agendas at bay when it came to fossils overall while countries did realize that current performance is unsustainable and requires more ambitious commitments once COP27 takes place. The richest nations also failed at doubling their efforts while they did provide a $100 billion annual climate financing pool extending from 2021 through 2025.
Holdings
I would always argue the most important aspect when considering an ETF as a possible investment vehicle, is to consider the holding structure in terms of how the underlying assets are distributed. When doing my due diligence, I have to consider this as if I were a portfolio manager trying to identify if this particular basket of stocks is worth investing in.
At the time of my most recent article, the top ten ETF holdings made up 48.8% while they as of 31st of December 2021 made up 53%, meaning that ICLN contains a lot of smaller positions who might fade into nothing but could also be the outsized winners of the portfolio looking forward as it is much more diversified, which I actually like given the industry remains relatively immature and that wide exposure is exactly the point of such an ETF in an industry where there will still be a lot of movement. Effectively, it puts the risk/return profile in a more interesting place seen from my standpoint as it removes some of the concentration.
Top Ten ICLN Holdings Financials Seeking Alpha
I’ve included a breakdown of the top ten positions of ICLN including some of the headline financials and if you want a comparison to how the situation was roughly one year ago, I suggest reading my previous article where I included the same breakdown.
A lot can happen in a year and the top ten breakdown really changed significantly. From average 53% 3Y revenue growth to 7%. From average forward P/S of 9.8 to 4.5 and with a 1-year average return of -25% compared to average 1-year return of 307%.
An immediate look at the included companies and it is evident that more stable businesses have become part of the top holdings. Especially as several utility companies have made it onto the list including Consolidated Edison Inc (ED), Iberdrola SA (SBDSF) and EDP Energias De Portugal (OTCPK:EDPFY) who are all characterized by low revenue growth and TTM net income beyond $1 billion in combination with low P/S ratios. Several companies still remain within the top ten such as Enphase Energy Inc (ENPH), Vestas Wind Systems (OTCPK:VWDRY), Ørsted (OTCPK:DNNGY), SolarEdge Technologies Inc (SEDG) and Plug Power Inc (PLUG). Particularly Plug was a concern to me a year ago as it was the largest holding coming in at above 8% ETF weight, while today only representing 5%. Plug offers hydrogen solutions meant for the future, and while opinions are many, I do respect that an ETF looking to the future contains exposure to what can be perceived as risky bets, especially as some of the core holdings are more stable utility companies, thus requiring some more risky bets as well. Having said that, I don’t personally want them to be the largest exposures and the financials for Plug also do look strange at first glimpse, but the forward-looking expectations are in the area of recovery.
Having previously argued that ICLN offered more or less nothing but bloated valuations, I’m also pleased to observe that all holdings are in the red YoY. The average market cap comes in at $27 billion in comparison to $22 billion a year ago while the average revenue has doubled from $5 billion to $11.4 billion supported by net income increasing from $418 million to $1.1 billion on average. All of this is a signal that the majority holdings within the ETF is driving stronger sales and profits at a not so much more expensive market cap. However, one could argue this comes at the expense of growth, which is also significantly lower YoY.
As it is a matter of risk profile, I personally prefer stable returns over time as opposed to the lottery ticket that might pay off big, but also flunk.
Going A Bit Deeper Into The Individual Holdings
While the bonanza of early 2021 has calmed with valuations appearing less frothy on the surface, it’s still worth it to sample a few of the companies and understand what financial shape they are in. Taking Vestas Wind Systems as an example, the leading wind turbine manufacturer in the world, catering to a marketplace that is expected to grow immensely in not just years, but decades to come.
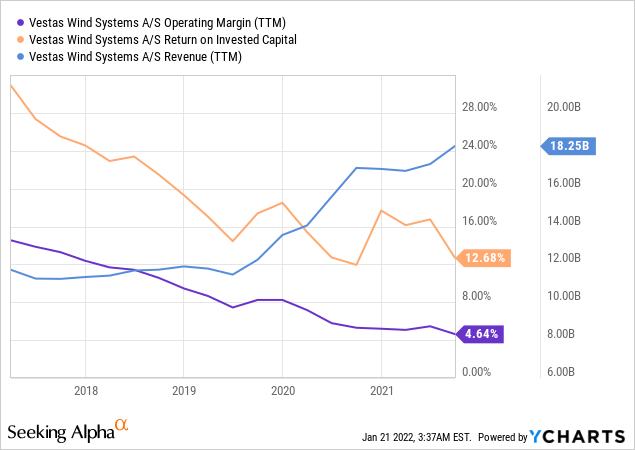
Vestas is in fact growing its revenue but also experiencing significant declines in return on invested capital and operating margin. As I expected that management is striving for sustainable growth, it appears that availability of subsidies is fading, and that competition is heating. The downtrend in operating margin is hard to argue against as it’s very clear. The margin wouldn’t how much further to go before going in red but with a P/E currently at 30, there is the possibility that profits could contract further, which would expand the P/E suggesting the market cap would have to come down. Question is, where the market participants find the balance is terms of also rewarding Vestas for the industry growth outlook which is undeniable. Vestas was also just awarded the title of most sustainable country in the world by Corporate Knights, underlining that Vestas will be spearheading the green transformation.
Another interesting example is Ørsted A/S, currently recognized as the leading offshore wind farm developer. Swimming in sustainability awards and pioneering the offshore development, this company should be one for the future. Consistently strengthening its backlog and with a strong management team in place, Ørsted appears set to meet the future, but the financials fluctuate wildly over time given its project nature affected revenues making it difficult to assess exactly where it might be going over an extended period of time.
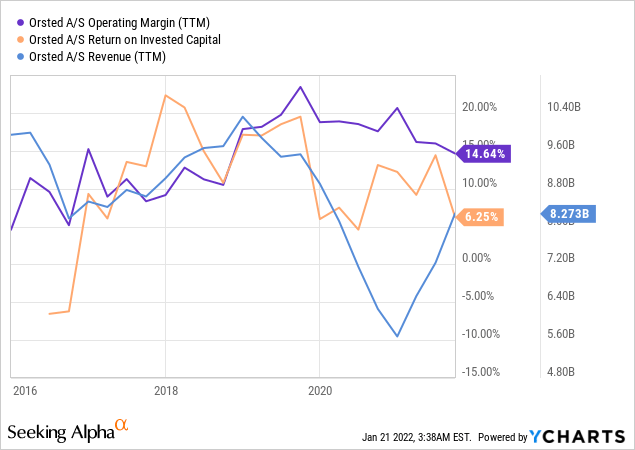
It is evident that margins are better for the developers, but I’d also like to emphasize that legacy players like Royal Dutch Shell (RDS.A) (RDS.B), British Petroleum (BP) and Equinor ASA (EQNR) amongst others are making their presence known in the offshore market, with aggressive bidding for offshore projects, something that has been touched upon in several interviews with the management of Ørsted. While these legacy players don’t yet hold massive backlogs of offshore wind projects, they have the capabilities to make their presence known as they have nothing but operate in the offshore environment for decades. This could make competition heat as the tenders will have more capable presence than previously where Ørsted had this new marketplace more or less to itself. Being a first mover also carries risk, and only a few quarters ago, the company announced a warranty provision of 800DKK million (roughly 120$ million) tied to problems with offshore projects, something that could affect profits in the coming period, and which has to be considered an operating risk when working with developing technology.
We of course also have to quickly visit the largest ETF holding, Enphase Energy and the solar market in general. Another market that is growing massively, carried by particularly China who have made up the majority of installations in the recent decade with more mature economies and markets finally moving. The marketplace is here to stay. A rule of thumb is, that in regions where there is strong wind, there is less sun and in regions where there is a lot of sun the wind is less so making a strong interaction between the two offerings in terms of green energy.
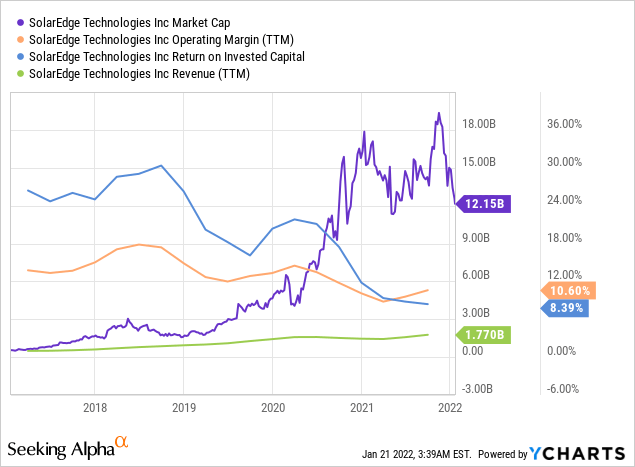
However, the solar panel market is another tough marketplace where margins have been growing thinner and with a large degree of fragmentation. The five-year graph above dilutes the revenue growth a bit as it has been picking up nicely in recent times, but as evident, the market cap surged upwards in a time of thinning margins and a numerically low revenue base. Coming down significantly from its peak, I’m not sure these companies deserve forward P/S ratios close to double digit when the margins aren’t stronger and with a marketplace yet to find its foothold. However, we can’t deny this is a growing market which more often than not means there is room for a significant number of players and Enphase seems to be here to stay.
The only thing left to say, is that we are witnessing serious moves in the interest rates while the leading central banks try to digest how inflation will settle. Higher interest rates make growth more expensive and the future cash flows is worth less. With this ETF focused on the future, that is something which could continue to assert downwards pressure and something investors need to keep in mind.
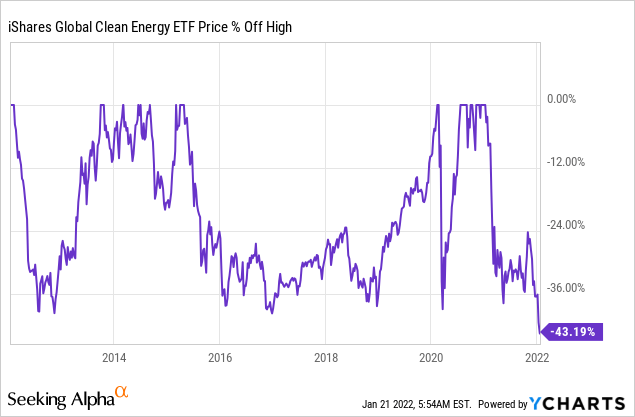
It is easy to perceive the largest fall from the top in the last decade as an obvious buy situation, and I’m not saying it isn’t, but with an outflow of assets under management, raising interest rates and innovative marketplaces yet to find their future business model and margins, I’d take it slow and build a position over time to reduce the impact of buying into what can be perceived as an obvious buy.
Conclusion
All in all, the transformation to green energies is a roaring train going full speed, so don’t get in its way, it’s been long since our politicians committed our economies to move in this direction, but it remains to be seen who will grab the lions share within different segments, making an ETF like ICLN an interesting way to obtain exposure. The pricing is much more attractive now than one year ago as the ETF has been diversified in its holding structure and since most of the companies have come down significantly from their peak. However, we can’t forget what happens to expensive assets when exposed to raising interest rates impacting future cash flows. It remains to be seen if ICLN is done trending downwards, and while I’m not ready to initiate a position myself I’d make use of dollar cost averaging if I had to, to try and avoid the volatility while growing the allocation to a full position, something that is unique to each individual investor. Seen from my standpoint, the downwards trending assets under management is another indicator that ICLN isn’t in favour these days even though the green transformation is very much so.
[ad_2]
Source link Google News

