[ad_1]
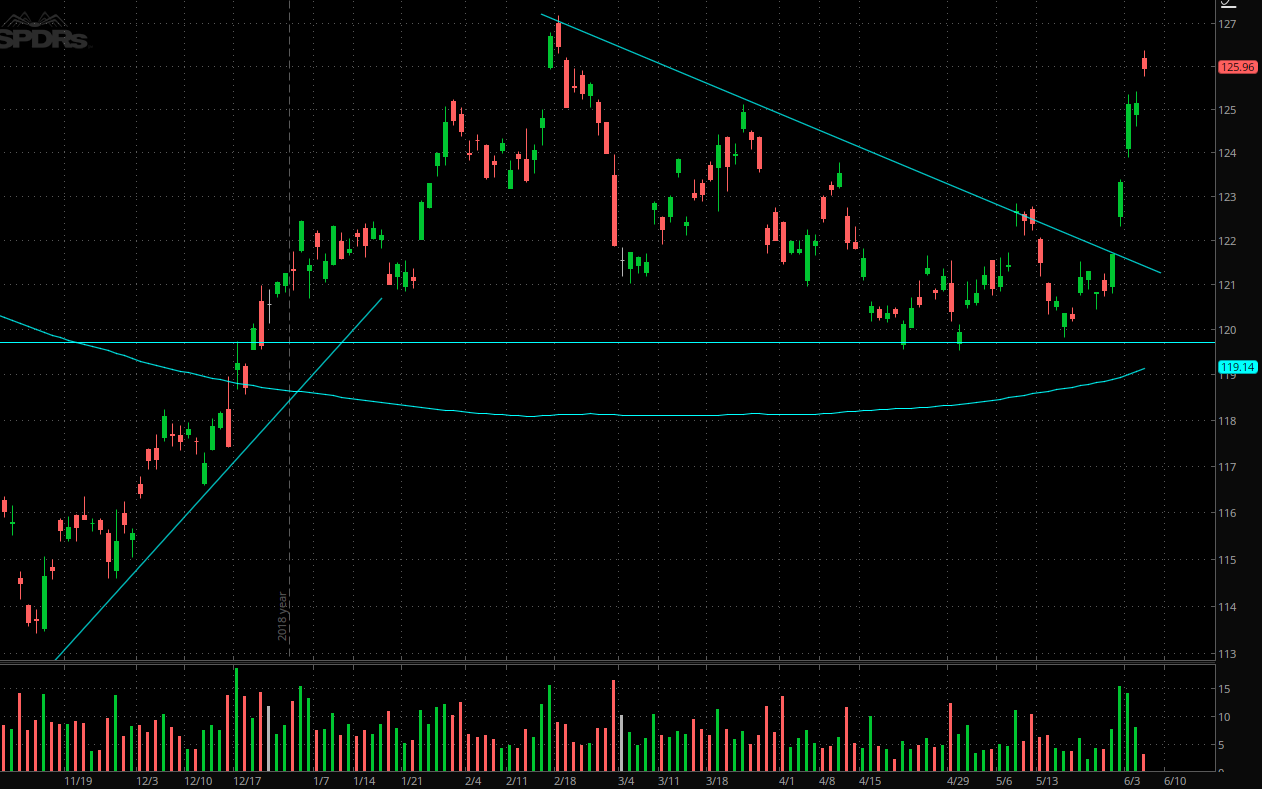
In times of rising economic uncertainty on a global scale, SPDR Gold Trust ETF (GLD) is displaying an interesting behavior as a portfolio hedge. The gold-tracking ETF has established as solid support at $120 per share, and it made an impressive move above key resistance levels in recent days.
Source: Think or Swim
GLD price action is too hot over the short term. However, both in terms of fundamental drivers and quantitative timing factors, SPDR Gold Trust ETF looks well positioned for solid gains going forward.
The Fundamental Picture
Gold and real interest rates have a negative correlation. Declining real rates reduce the opportunity cost of holding non-interest bearing assets such as gold, making GLD comparatively more attractive versus other alternatives in the market when real interest rates are moving down.
The chart below shows the monthly and yearly relationship between gold prices and real interest rates from 1975 to 2018. An image is worth a thousand words, and declining real rates are clearly a major tailwind for GLD.
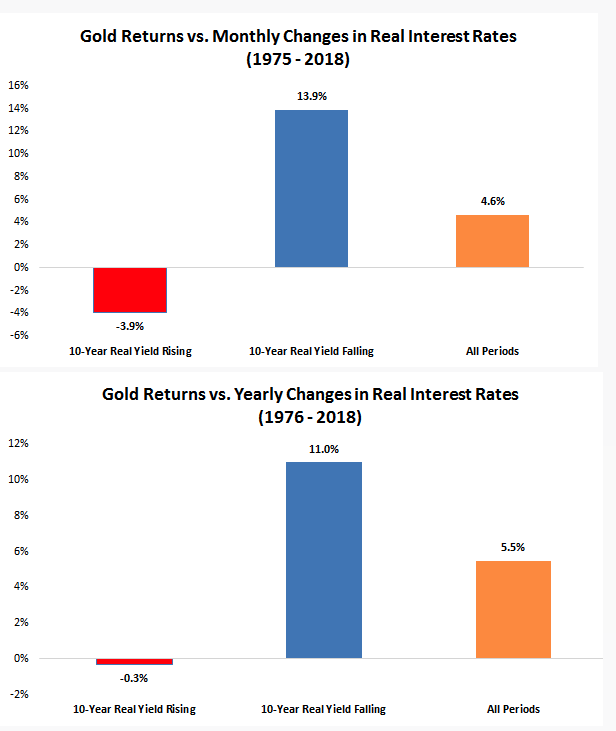
Source: Pension Partners
Due to the trade war uncertainty and economic jitters all over the world, real interest rates have been falling from a cliff in recent months. Nobody knows for sure what the future may bring, but as long as this trend remains in place, declining real rates are a major tailwind for GLD.
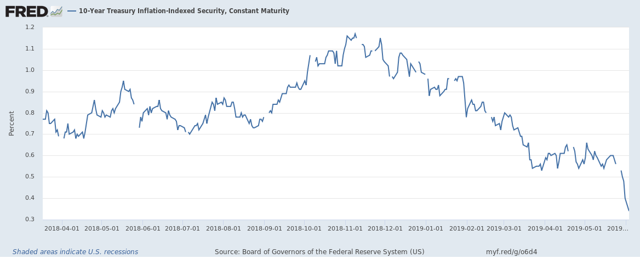 Source: Board of Governors of the Federal Reserve System
The negative relationship between real interest rates and gold prices provides a massive advantage in terms of diversification and capital protection.
Real rates tend to decline when investors are concerned about the economic outlook, so incorporating GLD into a portfolio of stocks and other risky assets can be particularly effective in terms of protecting the portfolio in a bear market environment for stocks.
In recent months we have seen a significant increase in the probabilities for a Fed rate cut based on futures prices. Markets are currently pricing a nearly 32.5% chance of a cut this month, a 74.3% chance of a cut in July, and 98.7% chance of at least one cut by the end of the year.
It’s not only long-term real rates declining, but markets are also saying that the probabilities for a Fed rate cut are significantly enlarged because of the increased risk of a recession or a big economic slowdown on the horizon.
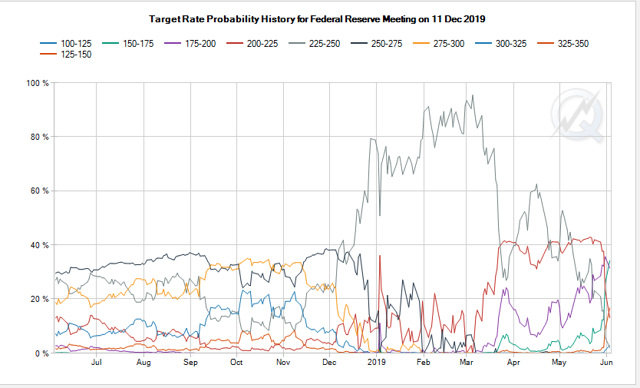 Source: CME FedWatch
Another potential tailwind for GLD in the middle term is the possible breakdown in the US Dollar if the economy continues decelerating. The chart below shows the negative correlation between GLD and Invesco DB USD Bullish ETF (UUP), with a 10 correlation coefficient of -0.8, the data is clearly showing that GLD and UUP tend to move in opposite directions.
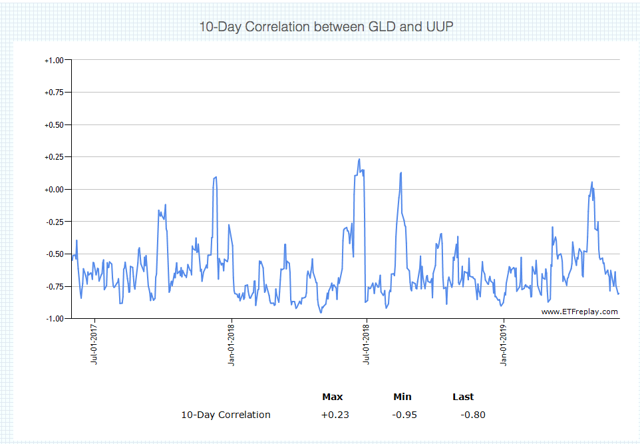
Source: ETFReplay
UUP has been under pressure in recent days, and the Dollar Index ETF is testing a critical support area at around $26. This is an important development to watch, if UUP finally breaks below support, it could provide more upside fuel to the recent rally in GLD.
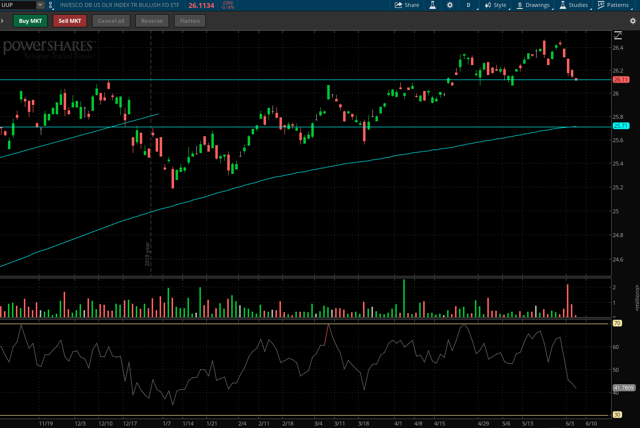 Source: Think or Swim
Trend And Relative Strength
When evaluating the timing for a position, it can be important to move beyond the more subjective technical analysis and incorporate quantified and objective indicators based on price trends and relative strength.
The Asset Class Rotation Strategy is a quantitative strategy available in The Data Driven Investor. This strategy rotates between 9 ETFs that represent some key asset classes.
- SPDR Gold Trust for gold
- Vanguard Real Estate (VNQ) for real estate.
- SPDR S&P 500 (SPY) for big stocks in the U.S.
- iShares Russell 2000 Index Fund (IWM) for small U.S. stocks.
- iShares MSCI EAFE (EFA) for international stocks in developed markets.
- iShares MSCI Emerging Markets (NYSEARCA:EEM) for international stocks in emerging markets.
- Invesco DB Commodity Index Tracking (DBC) for a basket of commodities.
- iShares 20+ Year Treasury Bond (TLT) for long-term Treasury bonds.
- iShares 1-3 Year Treasury Bond (SHY) for short-term Treasury bonds.
In order to be eligible, an ETF has to be in an uptrend, meaning that the current market price is above the 10-month moving average. Among the ETFs that are in an uptrend, the system buys the top 3 with the highest relative strength.
The main rationale behind this strategy is actually quite simple, the strategy wants to buy only the asset classes that are in an uptrend. Among the asset classes that are in an uptrend, it looks for the ones with superior risk-adjusted performance in comparison to the other asset classes.
Backtested performance numbers are remarkably strong. Since January of 2007, the strategy gained 310.1% versus 90.7% for the benchmark. The annual return is 12.1% for the strategy versus 5.3% for the benchmark over that period.
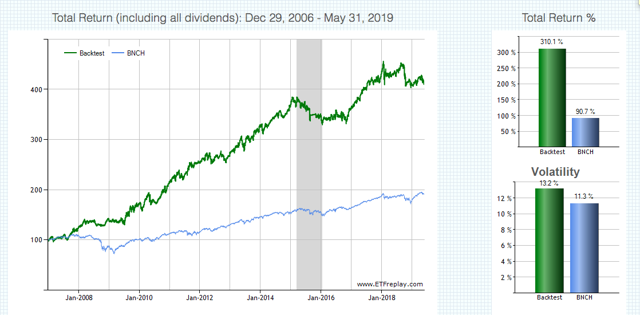 Source: ETFreplay
The Asset Class Rotation Strategy is also quite effective in terms of reducing downside risk. The maximum drawdown, meaning maximum capital loss from the peak, is 14.4% for the quantitative strategy versus 35.4% for the benchmark over the backtesting period.
 Source: ETFreplay
As of the most recent update to the Asset Class Rotation Strategy, GLD is one of the 3 ETFs selected by the strategy. This means that the timing indicators based on price trends and relative strength are looking bullish for GLD over the middle term.
After such a steep increase in the past few days, GLD is overbought on a short term basis, so waiting for a pullback is a better approach than jumping with both feet at current prices. Nevertheless, there are important tailwinds for GLD over the middle term in terms of both the fundamental picture and the quantitative timing indicators.
Statistical research has proven that stocks and ETFs showing certain quantitative attributes tend to outperform the market over the long term. A subscription to The Data Driven Investor provides you access to profitable screeners and live portfolios based on these effective and time-proven return drivers. Forget about opinions and speculation, investing decisions based on cold hard quantitative data can provide you superior returns with lower risk. Click here to get your free trial now.

Disclosure: I/we have no positions in any stocks mentioned, and no plans to initiate any positions within the next 72 hours. I wrote this article myself, and it expresses my own opinions. I am not receiving compensation for it (other than from Seeking Alpha). I have no business relationship with any company whose stock is mentioned in this article.
[ad_2]
Source link Google News

