[ad_1]
everydayplus/iStock via Getty Images
FPE strategy and portfolio
The First Trust Preferred Securities and Income ETF (NYSEARCA:FPE) is invested in income-producing securities, including corporate bonds, preferred and convertible securities. It was launched on 02/11/2013, has 323 holdings excluding cash and equivalents, a distribution rate of 4.70% and an expense ratio of 0.85%.
As described in the prospectus, the fund is actively managed combining a bottom-up and top-down approach.
The bottom-up analysis focuses on individual security analysis, idiosyncratic risks, credit fundamentals and opportunistic trading. The top-down analysis focuses on sector and industry analysis, duration and interest rate analysis, capital structure positioning and systemic risks.
Limits on issuer and industry weightings are implemented to ensure diversification. Most securities in FPE’s portfolio have a priority over common stock in the payment of distributions and the liquidation, but are generally junior to debt. FPE has 323 holdings with a weighted average effective duration of 4.28 years. The next table lists the top 10 securities, representing 13% of asset value.
|
Security Name |
Weight |
|
BARCLAYS PLC Variable rate |
2.04% |
|
AERCAP HOLDINGS NV Variable rate, due 10/10/2079 |
1.83% |
|
EMERA INC Variable rate, due 06/15/2076 |
1.45% |
|
Wells Fargo & Company, Series L, 7.50% |
1.42% |
|
HIGHLAND HOLDINGS BOND 7.625%, due 10/15/2025 |
1.27% |
|
JPMORGAN CHASE & CO Series V, Variable rate |
1.16% |
|
CREDIT SUISSE GROUP AG Variable rate |
1.03% |
|
Bank of America Corporation, Series L, 7.25% |
0.99% |
|
BNP PARIBAS Variable rate |
0.93% |
|
GLOBAL ATLANTIC Variable rate, due 10/15/2051 |
0.92% |
The top 8 issuers weigh about 20% of asset value:
|
Issuer Name |
Weight |
|
Citigroup Inc. (C) |
2.87% |
|
Barclays PLC (BCS) |
2.82% |
|
Credit Suisse Group AG (CS) |
2.70% |
|
JPMorgan Chase & Co. (JPM) |
2.54% |
|
Wells Fargo & Co. (WFC) |
2.38% |
|
AerCap (AER) |
2.33% |
|
Enbridge (ENB) |
2.26% |
|
Bank of America Corp. (BAC) |
2.17% |
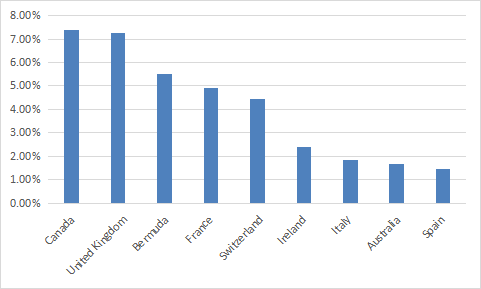
More than 57% of asset value is in U.S. securities. The next chart plots the weight of the heaviest countries after the U.S.
Countries ex-US (chart: author; data: First Trust)
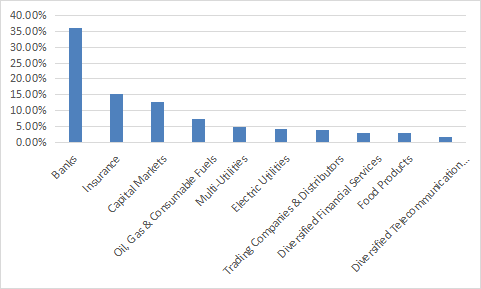
About 64% of asset value is invested in financial companies, with more than half of it in banks (36%). The next chart reports weights by industry.
Industries (chart: author; data: First Trust)
As for credit ratings, about 83% of asset value is invested in securities issued by companies rated from BBB+ to BB+.
Ratings (chart: author; data: First Trust)
Historical performance
A large part of FPE portfolio is in convertible bonds and preferred stocks, which are hybrid assets. As a consequence, its behavior inherits characteristics of stocks and bonds. Since inception, its correlation coefficient is 0.66 with the S&P 500 (SPY) and 0.44 with the total U.S bond market (BND). The next table reports performance and risk metrics since 2/18/2013, compared with these two benchmarks. It looks like the worst of both worlds: a bond-like total return with a stock-like maximum drawdown.
|
Total Return |
Annual.Return |
Max.Drawdown |
|
|
FPE |
54.38% |
4.90% |
-33.35% |
|
SPY |
244.74% |
14.60% |
-33.72% |
|
BND |
20.70% |
2.09% |
-8.67% |
Data calculated with Portfolio123
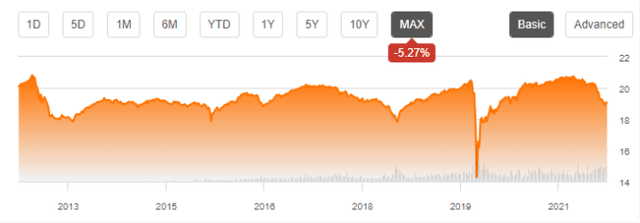
The annualized total return is close to the distribution rate, which means asset value is close to flat. In fact, the share price has lost about 5% since inception (next chart).
FPE share price (TradingView on Seeking Alpha)
Taking inflation into account, FPE doesn’t look very attractive as a “buy-and-hold” investment. However, there are other ways to use it: for example, as a component of a tactical allocation strategy.
FPE tactical rotation
Tactical allocation strategies consist of over-weighting assets with the highest probability of future gains. This probability is often arbitrarily measured by past performance. Countless variants are possible depending on the performance metric, weight calculation, look-back period, decision frequency, asset list, number of positions. The next table tracks a strategy with only two ETFs: FPE and the iShares 7-10 Year Treasury Bond ETF (IEF). Every week, it goes long 100% in the ETF with the highest 3-month return, or in cash if both have their prices below the 200-day simple moving average. This FPE-IEF rotational model is compared to its two components.
|
since FPE inception |
Total Return |
Annual.Return |
Drawdown |
Sharpe ratio |
|
FPE-IEF rotation |
25.90% |
2.57% |
-3.06% |
0.85 |
|
FPE |
54.38% |
4.90% |
-33.35% |
0.56 |
|
IEF |
20.38% |
2.06% |
-10.43% |
0.32 |
Calculations with Portfolio123. Past performance, real or simulated, is not a guarantee of future returns.
The result is still a bond-like return, but risk metrics (volatility, drawdown, Sharpe Ratio) are better than bonds. This may be a dynamic strategy to park some cash in bad times. A note of caution is needed: this simulation is run on a 9-year period. It includes severe corrections, but not a full market cycle.
Takeaway
FPE has provided bond-like performance with stock-like risks. Share price history points to a mild capital decay since inception. FPE doesn’t look attractive as a long-term holding. However, it may be used in a tactical allocation strategy along with bond ETFs. Based on past data, such a strategy may provide bond returns with a risk inferior to bonds. Past performance, real or simulated, is never a guarantee for the future: breaking the maximum drawdown would be a reason to reevaluate the strategy. My QRV Bond Rotation is based on the same idea applied to a set of funds in bonds and hybrid assets.
[ad_2]
Source links Google News

