[ad_1]
With the Federal Reserve lowering rates for the second time this year, the one thing investors can be sure of is more unhappy tweets from President Trump and another Fed Funds rate cut. Market prices and traders are currently implying a 66% chance that the Federal Reserve will reduce short-term interest rates by another quarter-point to at least a range of 1.5-1.75%. With oil prices surging 15% (USO) this past Monday, the Federal Reserve’s chances of cutting rates dipped ever so slightly as traders believed the lowering of rates could be kicked to the next FOMC meeting. With the risks of lower interest rates, a slower economy, higher energy prices, and maturity in the economic expansion, it makes sense for the investor and trader to have a plan for more long-bond asset allocation. In this article, we will discuss how the investor can earn appreciation and dividends through purchasing low cost aggregate bond exchange traded funds.
0% Interest Rate Chatter Grows
It will not be long before the spread of negative interest rates reaches the U.S., former Federal Reserve Chairman Alan Greenspan said to CNBC’s Squawk on the Street on September 4th. “You’re seeing extreme low rates pretty much throughout the world. It’s only a matter of time before it’s more in the United States,” Greenspan told CNBC’s “Squawk on the Street”. Investors globally are experiencing nothing in interest rate return, as investors are seeking capital preservation. With over $16 trillion in negative-yielding debt instruments around the world, global central banks are trying to ease monetary conditions to sustain a global economic expansion. The 10-year sovereign bonds in Belgium, Germany, France and Japan are all trading or flirting with a negative rate. If Alan Greenspan and other key interest rate observers are correct, we could see another significant leg higher in the bond bull market, as investors bid up the prices for bonds in search of safety.
Long Bonds Continue To Work
Investors should consider owning bond funds right now as their largest allocation in balanced portfolios for two reasons:
1. Equity like returns with bond like volatility.
2. Capital preservation and lower beta.
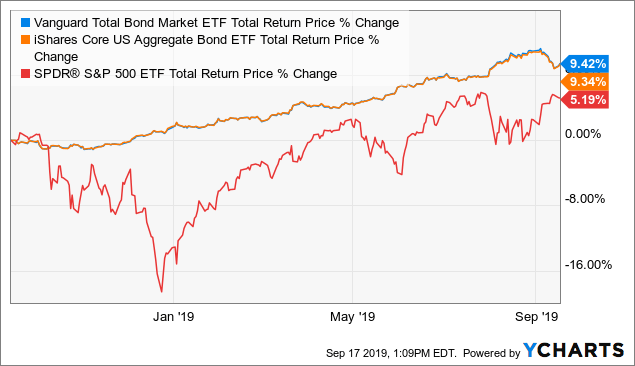
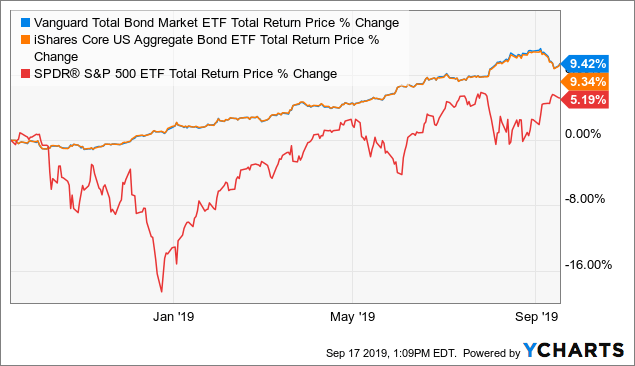
When you factor in these two reasons, it’s hard to not like bonds right now. Aggregate bond funds are producing 7% to 8% annual returns this year, while taking 66% less price volatility risk to do so. Let’s take a look below at a couple fixed income exchange traded funds below and how they are stacking up against the S&P 500 (SPY):
 Data by YCharts
Over the past year, the Vanguard Bond ETF (BND) has outperformed the S&P 500 by 400 basis points, and the iShares Barclays Aggregate Bond ETF (AGG) has outperformed the markets around 400 basis points as well. Year-to-date, the S&P 500 is outperforming by a larger margin of over 10%. However, the above chart shows the relative flat price volatility you are experiencing by owning a larger position in BND vs the S&P 500 fund.
“Don’t Fight The Fed”, & Purchase BND
The saying, “Don’t fight the Fed”, is very much still in use today. When the Fed started increasing rates at the end of last year, short-term Treasury yields went higher while equity prices sold off. Now, the Fed has decided to step on the gas by decreasing the short-term Fed Funds rate causing equities to increase and short-term bond yields to decrease. However, the long-end of the curve is dropping based on the details the Fed is providing about our recent economic conditions. Seven members of the FOMC’s 17 participants see at least one more 25 basis point rate cut by the end of the year. Where is the investor to allocate new capital when the Fed is sending the message of even lower long-term rates and slower economic conditions?
Vanguard’s Total Market Return Bond ETF
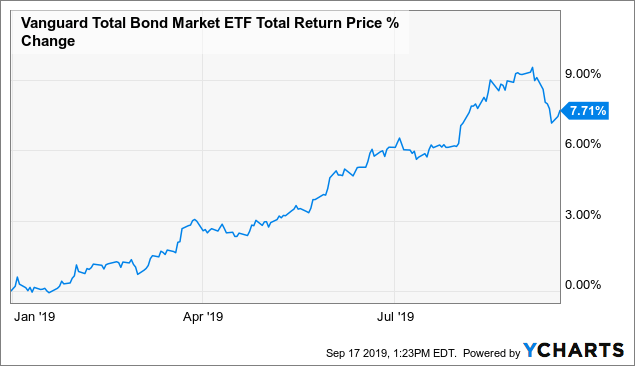
Most investors and professionals purchase bonds for the safety of principal and the interest yield. However, entertain me for a minute and consider why you should focus on the total return and more importantly the price appreciation. Bonds could see much more appreciation due to the demand for bonds as a whole from lower yields, safety of principal, and an aging demographic. The BND ETF only pays a current dividend yield of 2.5%, but the total return this year is closer to 8%. Take a look below at the year-to-date numbers:
 Data by YCharts
The major factor of this higher return as of late is the clear message of a potential economic slowdown. Continuing to cite global concerns, the Fed said business investment “weakened” since the Fed’s last policy setting meeting in July, when it cut rates for the first time since 2008. We have to always look at the total return, and not just what the interest rates are when considering an investment in a fixed income instrument.
Key Investment & Risk Metrics To Consider
The key investment objectives to Vanguard’s BND are to provide broad exposure to U.S. investment grade bonds and to keep pace with the U.S. bond market returns. What I like most about BND is the simple way of diversifying your fixed income assets across all bond sectors. Many active managers are trying to beat the indices by taking more risk through mortgage-backed securities or non-investment-grade bonds which help cause the financial crisis in 2008. BND is a great way to own solid investment grade securities through its massive $232 billion in assets under management. Let’s take a look under the hood below at the holdings of BND:
BND Characteristics as of 08/31/2019
|
Fund total net assets |
$232.2 billion |
|
Number of bonds |
8603 |
|
Average effective maturity |
8.2 years |
|
Average duration |
6.0 years |
|
Yield to maturity |
2.5% |
|
U.S. government holdings |
64% |
|
Aaa-A |
18% |
|
Baa |
18% |
(Source: Vanguard)
The fund profile looks good as more than 80% of the assets are investment grade, yielding roughly 2.5%. I also like that the fund owns mostly U.S. government securities with an average duration of six years, which is very intermediate. What is most important for the investor to take away is the reason why BND should be added to your portfolio, which is to diversify your equity holdings, and bring down the beta. Let’s take a look below at the fund’s risk metrics below as well:
| Metric | BND |
|---|---|
| Arithmetic Mean (monthly) | 0.33% |
| Arithmetic Mean (annualized) | 4.07% |
| Geometric Mean (monthly) | 0.33% |
| Geometric Mean (annualized) | 4.00% |
| Volatility (monthly) | 1.06% |
| Volatility (annualized) | 3.67% |
| Downside Deviation (monthly) | 0.56% |
| Max. Drawdown | -4.01% |
| US Market Correlation | 0.01 |
| Beta(*) | 0.00 |
| Alpha (annualized) | 3.98% |
| R2 | 0.00% |
| Sharpe Ratio | 0.94 |
| Sortino Ratio | 1.72 |
| Treynor Ratio (%) | 2,810.02 |
| Calmar Ratio | 0.88 |
| Active Return | -4.35% |
| Tracking Error | 16.01% |
| Information Ratio | -0.27 |
| Skewness | 0.51 |
| Excess Kurtosis | 3.61 |
| Historical Value-at-Risk (5%) | -1.30% |
| Analytical Value-at-Risk (5%) | -1.41% |
| Conditional Value-at-Risk (5%) | -1.99% |
| Upside Capture Ratio (%) | 8.35 |
| Downside Capture Ratio (%) | -10.14 |
| Safe Withdrawal Rate | 10.63% |
| Perpetual Withdrawal Rate | 2.32% |
| Positive Periods | 90 out of 140 (64.29%) |
| Gain/Loss Ratio | 1.33 |
(Source: Portfolio Visualizer)
The first and most important ratio to look at is the Beta reading at 0. When you purchase shares of BND, the ETF will not move in lock step at all with equities. The market correlation reading as well comes in at .01, which translates to the fund moving 1% of the time with the S&P 500. When building out a balanced portfolio of equities, this fund will do a spectacular job of decreasing your portfolio risk as a whole. You also can expect the fund to move roughly 3.67% up and down per year, which is the fundamental reason why investors purchase it.
Summary & Looking Forward
When considering if the Vanguard Bond Total Return Bond ETF is for you, consider the total return element, and not just the yield. Total return determines an investment’s true growth over time. It is important to evaluate the big picture and not just one return metric like the SEC Yield when determining if the investment is appropriate for you. Many investors chase higher yielding fixed income securities (JNK) and only focus on the coupon, while not fully understanding the safety of the principal. Once you consider the total return profile (capital appreciation + dividends), funds like BND look much better. The BND ETF allows you to make investment-grade yield and not risk your principal buy purchasing junk rated debt at 5% instead of 2.5%. Looking forward, investments in ETF’s such as BND will protect your assets from economic slowdowns, oil spikes, and trade war tantrums. When you look at purchasing bond funds for your portfolio, it is pertinent to consider how these funds are generating the dividend yield. All bond funds are not created equal, and you won’t find many active managed funds with an expense ratio of .035% vs. the active manager expense ratio at .65%. Follow the minutes in the Fed statements and find some safety within the Vanguard Total Return Bond Fund.
Disclosure: I am/we are long AGG, SPY, SPLV, SPHD, JPST, MINT, DBLTX, PONAX, SEMPX. I wrote this article myself, and it expresses my own opinions. I am not receiving compensation for it (other than from Seeking Alpha). I have no business relationship with any company whose stock is mentioned in this article.
Additional disclosure: These are opinions of Mr. Josh Ortner, CTFA, and should not be construed as personal financial advice to your own situation. Ortner Capital consults clients who own the above listed securities.
[ad_2]
Source link Google News

