[ad_1]

marchmeena29
(This article was co-produced with Hoya Capital Real Estate)
Introduction
IronHorse Capital Management recently converted their Conductor Global Equity Value mutual fund (RAILX) into an exchange-traded fund (“ETF”) with the same name and investment focus. I only found one other ETF that is both Global and Value in their investment approach, which makes the Conductor Global Equity Value ETF (NYSEARCA:CGV) worth examining in its new form. Whether Value investing makes sense is covered under the Portfolio Strategy section of this article. Since the ETF acquired the assets of the mutual fund and the Prospectus states they inherited its history, I will use the data which seems best for the point being analyzed.
Who is IronHorse Capital Management?

goironhorse.com
The Advisor for Conductor ETFs is IronHorse Capital Management. Established in 2009, IronHorse is a research-driven investment management firm implementing risk-conscious global equity investment strategies in liquid vehicles. We focus on finding attractive investment opportunities both at home and around the globe while maintaining a macro risk perspective on the overall markets.
IronHorse invests in attractively valued companies with financial flexibility and uniquely fitted management teams. IronHorse believes careful, in-depth analysis of a company’s financial strength and risk profile is the most comprehensive method of assigning proper valuations, identifying catalysts and reducing risk of investment.
Source: conductoretfs.com
Their philosophy statement is:
Global diversification gives IronHorse the ability to scan the world for investments that fit our value-oriented philosophy, thus improving our potential to produce outsized returns in all market environments. Meanwhile, global diversification helps diminish overall portfolio risk over time. In the end, IronHorse remains steadfastly focused on superior risk-adjusted return. Strategic, multi-level diversification gives IronHorse investors an advantage.
Source: goironhorse.com Philosophy
Their website goes on to list steps and inputs used to construction CGV’s portfolio. These include the following:
- Liquidity: Each name must adhere to strict market cap and volume rules. Median market cap is approximately $4 billion with median daily trading volume of nearly 1.5 million shares.
- Growth to Value: IronHorse invests in global mid to large cap equities, primarily focusing on investments in developed regions and markets. The investment selection process is value-oriented.
- Top down/Bottom up: It is possible to find the right balance of return opportunity and risk management. We do so by balancing a global top-down macro analytical process, with traditional value-oriented, fundamental equity research and stock-picking. IronHorse complements its bottoms-up, fundamental single-stock orientation by analyzing and shaping the portfolio at the sector level. Various criteria such as valuation, growth potential, and overall market environment guide the allocation process.
Conductor Global Equity Value ETF review
IronHorse provides this description of their ETF:
The Conductor Global Equity Value ETF (CGV – NYSE) is an actively managed ETF focused on the purchase of Global Equities using multiple value factors across a series of metrics. The majority of the Equities in the ETF tend to fall into the Small and Mid- Cap size categories. All equities purchased outside the US are purchased in the foreign country, on the local exchange in the local currency. No currency hedging is employed by the strategy. The CGV ETF started around 8/1/22, though history dates to 2013.
Source: conductoretfs.com CGV
CGV has $64m in assets, mostly from the conversion of the pre-existing mutual fund into this ETF. That fund was averaging a 2% yield. The fee schedule for CGV is:

conductoretfs.com CGV Prospectus
The fee waiver is adjustable and extends to April 2023, but the managers do not see fees paid by investors being more than the 128bps paid today. The recently amended Prospectus provides more on the managers and risks investors could face owning this (or any) ETF.
Holdings review
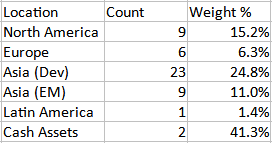
Using current data, I was able to determine both the regional and country weights of the ETF.
conductoretfs.com; compiled by Author
Two things stand out. First is the 41% allocation to cash. This is the advantage of being an actively managed ETF not wedded to a benchmark. Currently the managers do not see enough Value investments to commit 100% of their funds. The second is the large underweight in US stocks, which they believe are overvalued compared to International stocks at this time.
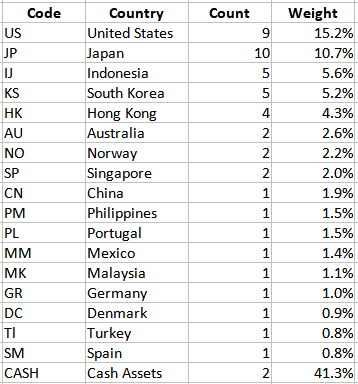
conductoretfs.com; compiled by Author
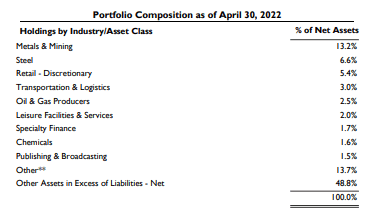
Even though US stocks are underweighted, they still represent the largest country allocation, with Japan placing second. The most current sector breakdown available is the mutual fund version from the end of April.
conductoretfs.com MF Semi-Annual report
The managers said the current allocation favors Energy and underweights Technology stocks.
Top holdings
conductoretfs.com; compiled by Author
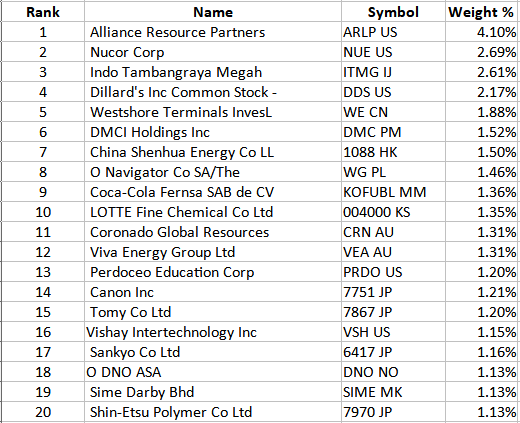
Currently CGV holds 48 stocks, 2 cash assets, and 9 currency Spot contracts. Ignoring cash as the “top position”, the Top 10 are just under 21% of the portfolio; the Top 20, 32%.
Performance review
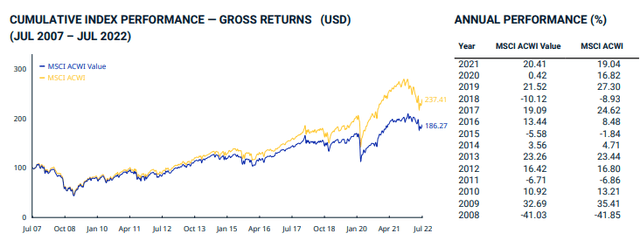
Here I will show how the benchmark has done, realizing that both the MF was, and the ETF will be actively managed. Then I will show how the acquired MF performed.
msci.com Index
The MSCI ACWI Value index underperformed the MSCI ACWI index in 10 of the 14 years since 2008. Since 1996, its 50bps behind; 192bps behind over the past decade, though the 1-Yr and YTD shows the Value Index with a big lead. There is little difference in StdDev across all time periods provided.

conductoretfs.com Amended Prospectus
Part of the MF underperformance compared to the Index is due to the almost 2% fees investors incurred, but that doesn’t explain some of it.
Portfolio strategy
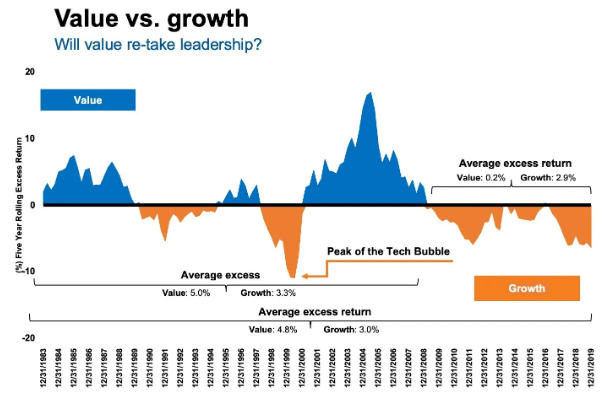
Maybe at this point, you like the potential CGV presents but intelligently ask if Value investing is better than owning the market-cap sector. The above Index chart surely brings that into question. I tackled that subject in my Pondering Growth Vs. Value article. Part of that article provides one set of definitions for Value and Growth stocks. A key chart showed that Value and Growth stocks move in long cycles. This chart end after 2019. For this article (Value vs. Segment), when Value stocks beat Growth stocks, then they also beat the full segment.
russellinvestments.com Value Vs. Growth
Since the above chart ended, Growth was better in 2020, with Value on top in 2021 and so far in 2022. Could this mean the time for Value has started?
To see overall each market-cap segment did as opposed to its Value-only stocks, I used data available via PortfolioVisualuzer.com which has such data back to 1972.

portfoliovisualizer.com
Across all three market-cap sectors, Value stocks outperformed and did that with less StdDev, resulting in superior risk ratios. Looking at just east decade, both return and risk data slightly favored the overall market in each segment. It could be reversing again as value was better over the past twelve months, especially in the Small-Cap segment where Value outperform the full segment by around 900bps. A small extra benefit Value stocks provide is less correlation to the market-cap they represent. So while Value has trailed Growth since RAILX started in late 2013, longer history supports the notion that Value pays.
Final thoughts
I have compared a some Value funds over the last few years that readers might to include as part of their due diligence process:
For the more adventurous, one could build a model that indicates when to move from Value to Growth stocks and back again. I tested a simple model using Large-Cap stocks and it showed some Alpha generation (Skip Vanguard’s VV ETF And Build Your Own Growth And Value Allocation Using The VUG And VTV ETFs).
[ad_2]
Source links Google News

