[ad_1]
Torsten Asmus/iStock via Getty Images
Investment Thesis
Inflation rose a record 8.5% in March, with an 18.3% monthly rise in gasoline prices accounting for more than half of the total increase over February’s numbers. Interest rates are rising rapidly in response, but how successful the Fed will be is unclear. Economists expect inflation to stay above 3% until the end of the year, possibly longer. As an ETF analyst, I want a fund to have some built-in inflation protection, often through exposure to Energy and Financials stocks but occasionally in defensive sectors like Utilities should the economy fall into recession.
The dynamic nature of ETFs means regular analysis is required, but what if inflation protection was an explicit part of the fund’s objectives? That’s where the Fidelity Stocks For Inflation ETF (BATS:FCPI) comes in, and I think it would make an excellent short-term addition to your portfolio. FCPI holds 100 highly profitable large- and mid-cap stocks with significant growth potential trading at attractive prices. It’s a nice mix of quality and momentum, and I hope you’ll add it to your shortlist of ETFs to buy after reading this article.
ETF Overview
Strategy and Fund Basics
FCPI tracks the custom Fidelity Stocks for Inflation Factor Index. Its prospectus describes the Index as holding a collection of “large and mid-capitalization U.S. companies with attractive valuations, high quality profiles and positive momentum signals, emphasizing industries that tend to outperform in inflationary environments.” Regarding the inflation factor, the approach is top-down, meaning specific sectors and industries are emphasized rather than individual securities. For the quality and momentum factors, the process is bottom-up. I believe this explains why some of the selections seem strange, especially with Technology accounting for 20% of the fund. This sector is sensitive to rising interest rates, which, in turn, is often a consequence of high inflation. I’ll be examining the FCPI at the industry level later, but first, here is a list of descriptive statistics for easy reference.
- Current Price: $34.09
- Assets Under Management: $99 million
- Expense Ratio: 0.29%
- Launch Date: November 5, 2019
- Trailing Dividend Yield: 1.36%
- Number of Securities: 100
- Portfolio Turnover: 52.00%
- Assets in Top Ten: 32.58%
- 30-Day Median Bid-Ask Spread: 0.20%
- Asset Class Size: Multi-Cap
- Tracked Index: Fidelity Stocks For Inflation Factor Index
- Weighting Scheme: Tiered
You can see that it’s a small fund with only $99 million in AUM, and it’s more costly than plain-vanilla funds per its 0.29% expense ratio. The median bid-ask spread of 0.20% is well above average, too. High spreads act as a hidden trading cost, and it’s surprising given how many of FCPI’s constituents are highly liquid. If you plan on taking a position soon, manage it with limit orders.
Sector Exposures and Top Ten Holdings
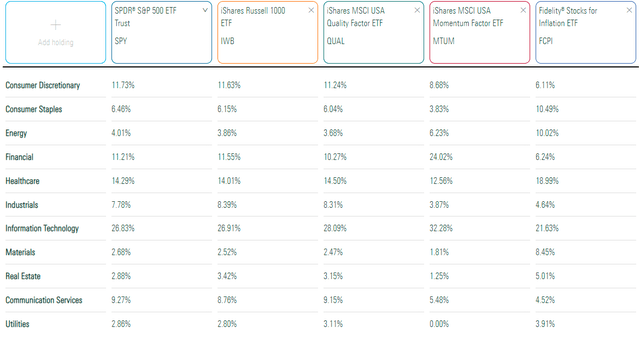
The table below highlights FCPI’s sector exposures against four others. The first two (SPY and IWB) were chosen since they are plain-vanilla funds that adequately represent FCPI’s stock universe. I selected the next two (QUAL and MTUM) since they screen for the same factors as FCPI, and they are among the largest funds by AUM in their respective categories.
Morningstar
FCPI appears to be the most balanced ETF by sector, with weights ranging from 3.91% for Utilities to 21.63% for Technology. In contrast, SPY and IWB have a range of about 3% to 27%, while QUAL and MTUM have even more exposure to Technology stocks. Therefore, while 20%+ exposure to the Technology sector is a bit strange, there’s a definite lean away from these types of high-growth companies.
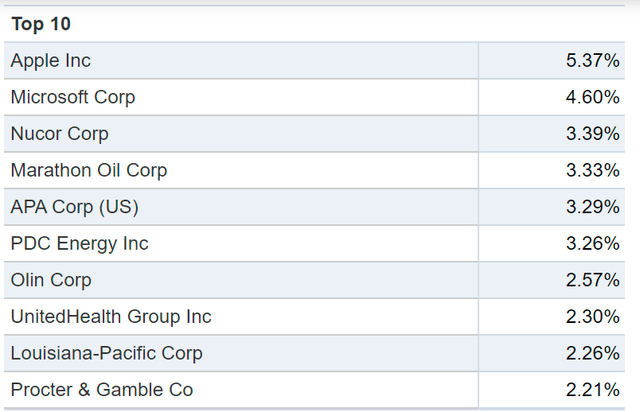
Apple (AAPL) and Microsoft (MSFT) are FCPI’s top two holdings, with a combined exposure of around 10%. Next is Nucor (NUE), a steel stock whose price has nearly doubled over the last year. After that, we have three Oil & Gas E&P stocks: Marathon Oil (MRO), APA Corp. (APA), and PDC Energy (PDCE). There’s a nice mixture of quality and growth with the two tech stocks and inflation protection with the steel and energy stocks.
Fidelity
Historical Performance
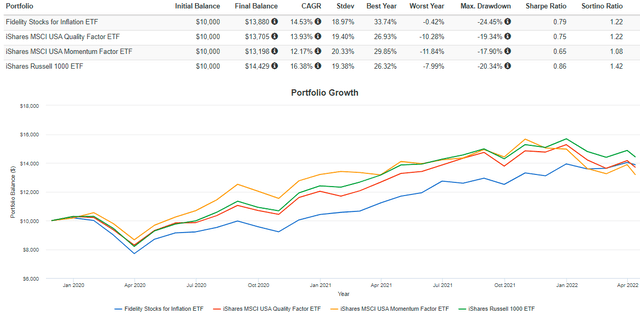
The graph below shows how FCPI has performed against QUAL, MTUM, and IWB since its inception. We have limited data to work with, but FCPI managed to outperform the two factor ETFs with less volatility but underperformed its secondary benchmark by an annualized 1.85%.
Portfolio Visualizer
However, most of this underperformance came in 2020 when FCPI trailed IWB by 18.54%. As inflation began to soar in 2021, FCPI outperformed by 7.42%. YTD, FCPI is down 0.42% compared to 7.99% for IWB, so it’s performed relatively well in this high-inflation environment.
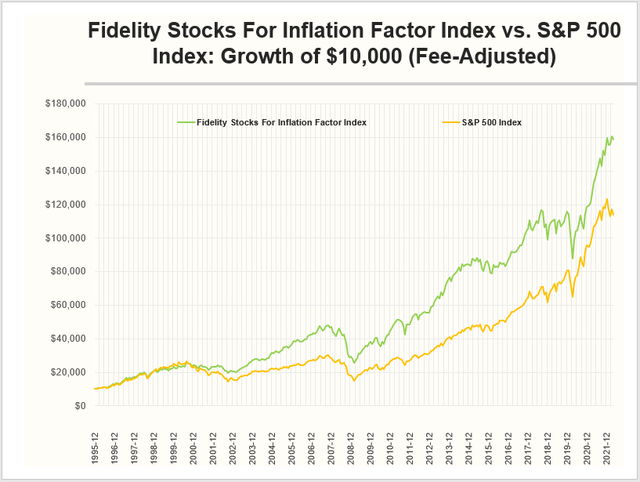
S&P Global Indices provides backtested data on the Index to January 1996. I’ve graphed the results after reducing returns by FCPI’s 0.29% fees monthly and compared them with actual returns for the SPDR S&P 500 ETF (SPY). The results were overwhelmingly positive but, like all backtested indexes, should not be wholly relied on. Nevertheless, here are the results, followed by some additional commentary.
Author
From January 1996, backtested Index values (adjusted for fees) suggest FCPI would have had an annualized return of 11.07%, turning $10,000 into $158,694. This growth was substantially better than SPY’s annualized return of 9.68%, which resulted in an ending balance of $113,922. In addition, the annualized standard deviation was lower for FCPI (14.42% vs. 15.10%).
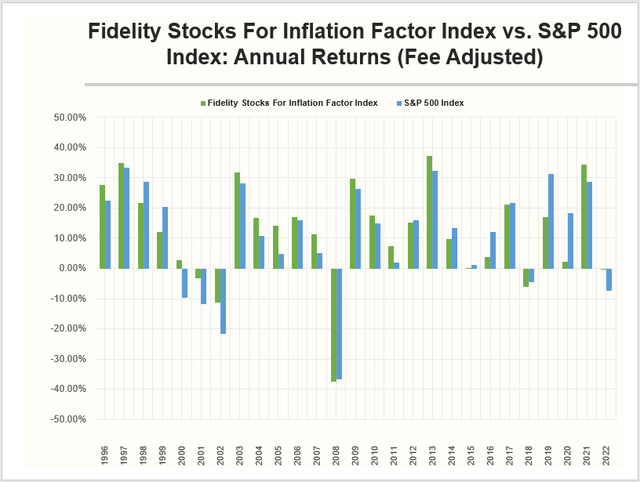
The next graph looks at annual returns for both indexes, including YTD through April 12, 2022. It becomes more apparent that backtested returns paint a positive picture primarily because of a few good years of outperformance during market downturns.
Author
If we only measure returns from January 2003 onwards, FCPI’s annualized return was similar (11.12%), but the S&P 500’s return was close at 10.75%. Volatility for FCPI remained about the same, with annualized standard deviation being 14.44%, but the S&P 500’s came in lower at 14.14%. FCPI’s advantage nearly disappears if we exclude the era when tech stocks were unprofitable. Given the solid financial health of today’s tech companies, I’d argue excluding these years is appropriate.
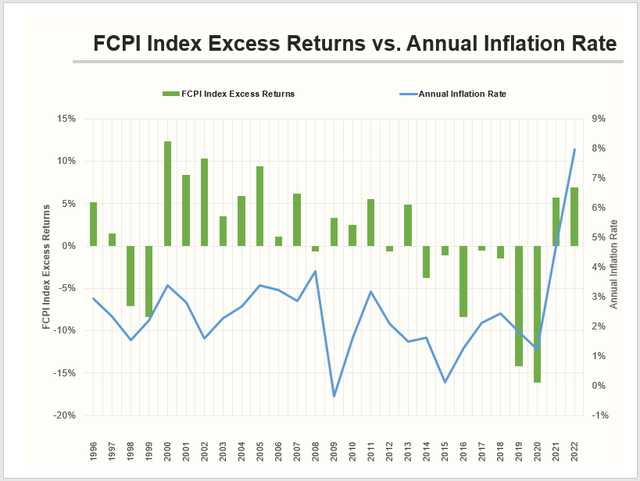
Still, it’s clear FCPI succeeds when inflation runs above normal. This last chart highlights its excess returns over the S&P 500 alongside the average annual inflation rate as reported by the U.S. Bureau of Labor Statistics. The average annual inflation rate since 1996 is around 2.50%. In years where inflation was above 2.50%, FCPI outperformed the S&P 500 by 6.01% on average. In contrast, in years where inflation was below 2.50%, it underperformed by 2.23% on average.
Author
Fundamental Analysis
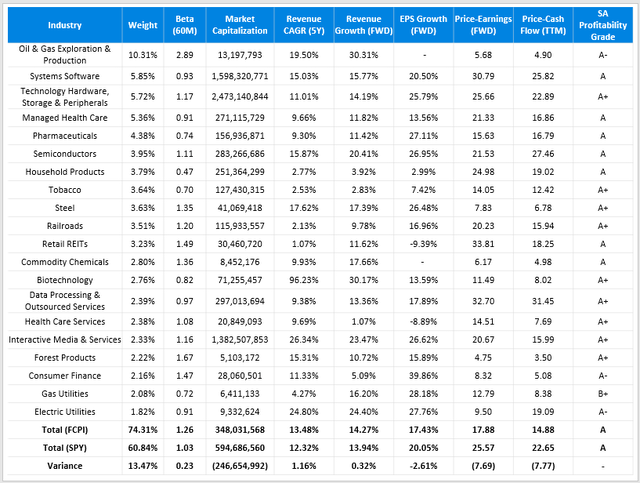
The table below highlights various metrics for FCPI’s top 20 industries and compares them with SPY. I think you’ll agree that FCPI scores well on nearly all of these metrics.
Author
Notably, FCPI beats SPY on historical and estimated revenue growth. It also trails by just 2.61% on estimated EPS growth, but that figure likely would be higher had growth for the three Oil & Gas E&P companies been measurable (earnings last year were negative). Not shown above, but estimated EBITDA growth for FCPI is 19.31% compared to 19.54% for SPY, so I think it’s safe to say the gap will close should energy prices remain elevated.
FCPI is trading at a substantial discount on forward price-earnings (7.69x) and trailing price-cash flow (7.77x). With a forward P/E of 17.88x, FCPI ranks in the top 15% of all large-cap and total-market-cap dividend ETFs in my database (313 funds in total). Its constituents’ Seeking Alpha Profitability Grade of “A” is identical to SPY, so you’re still getting a high-quality fund for a low price.
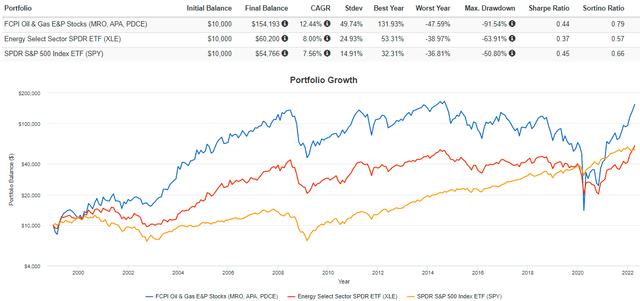
One downside is volatility. I’ve estimated FCPI’s five-year beta to be 1.26, caused by volatile small- and mid-cap oil stocks. I’ve graphed the performance of the three E&P stocks mentioned earlier. The standard deviation of 49.74% is enormous, even compared to the Energy Select Sector SPDR ETF (XLE).
Portfolio Visualizer
Investment Recommendation
FCPI’s history is limited, but it underperformed in 2020 and outperformed in 2021-2022 as expected since the average annual inflation rate rose from 1.23% to 4.70% to 7.97% in those three years. Though not free from bias, my analysis of backtested data also suggests FCPI would have performed well in years where inflation is above 2.50%. Considering the FOMC’s long-run objective is 2%, FCPI probably isn’t a great buy-and-hold ETF.
Still, OECD forecasts suggest inflation will remain above 3% for the rest of the year, falling only to the 2.50% mark in Q4 2023. FCPI could be an excellent short-term ETF to buy in the interim. My analysis of FCPI’s fundamentals is also encouraging. It has strong revenue, EBITDA, and EPS growth rates, along with a low 17.88x forward P/E ratio and profitability metrics as good as the S&P 500 Index. The key downside is volatility, so while timing risks are high, I recommend buying FCPI today if your portfolio lacks exposure to inflation-protecting stocks. While a little unorthodox, the approach does its job, and I think FCPI has a solid shot at outperforming for the foreseeable future.
[ad_2]
Source links Google News

