[ad_1]

Sundry Photography/iStock Editorial via Getty Images
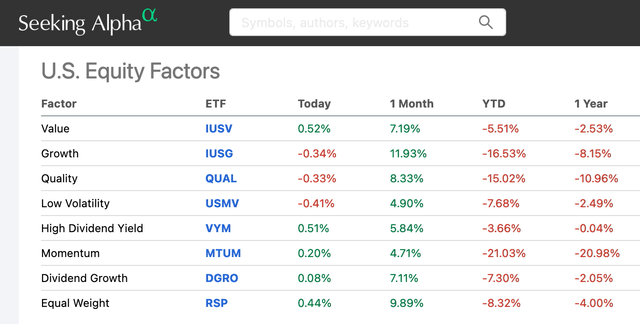
The recent bull-market greatly rewarded growth investors, but all it took was the bear-market of 2022 to reaffirm the value of having an allocation to dividend income stocks within a well diversified portfolio in order to smooth out the ups-n-downs of the market. Indeed, as the graphic below shows, the “High Dividend Yield” category is basically flat over the past year while “Growth” is down 8%, while the S&P500 is down 5%. Those metrics are even more favorable when looking at the YTD numbers, which more fully reflect the damage done by the 2022 bear market.
Seeking Alpha
That being the case, today I’ll take a look at the Fidelity High Dividend ETF (NYSEARCA:FDVV) to see if it is a good choice for an allocation within your well-diversified portfolio and how the fund has positioned investors for success going forward.
Top-10 Holdings
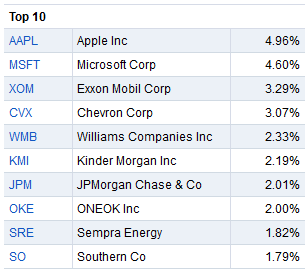
The top-10 holdings in the FDVV ETF are shown below and equate to what I consider to be a relatively well-diversified 28% of the entire 116 stock portfolio:
Fidelity Investments
Source: Fidelity FDVV ETF Webpage
The top-two holdings are well-known tech giants Apple (AAPL) and Microsoft (MSFT) with an aggregate weight of 9.6%. Apple has a low yield (0.53%) but is buying back shares and is up 15.5% over the past year. On Apple’s Q3 FY22 conference call last month, investors learned from CFO Luca Maestri that Apple:
… returned over $28 billion to shareholders during the June quarter. This included $3.8 billion in dividends and equivalents and $21.7 billion through open market repurchases of 143 million Apple shares. We continue to believe there is great value in our stock and maintain our target of reaching a net cash neutral position over time.
That being the case, it is interesting that the #1 holding in a “Dividend” ETF like FDVV is a stock in which the main investment thesis going forward is capital appreciation, not income. The same is true of Microsoft as well (yielding 0.84%).
Taken together, Exxon (XOM) and Chevron (CVX) equate to a 6.35% weight and a bit more on target with respect to the dividend thesis – yielding 3.8% and 3.5%, respectively. As I am sure you are aware, Exxon and Chevron both delivered record quarterly FCF in Q2 and the outlook for dividend growth going forward is excellent. Exxon is up 59% over the past year while Chevron is up 54%.
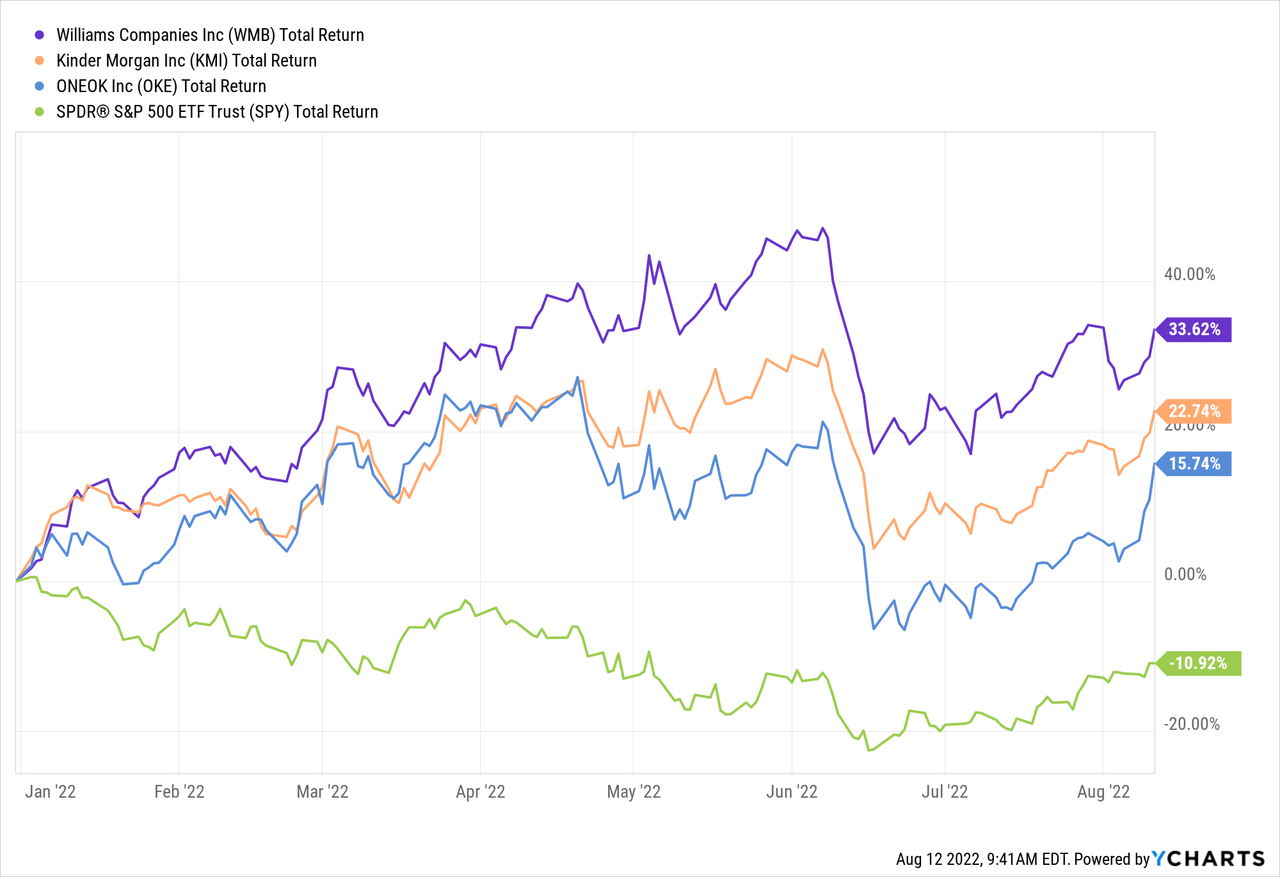
The #5, #6, and #8 holdings are midstream energy companies Williams (WMB), Kinder Morgan (KMI), and ONEOK (OKE), with a combined allocation of 6.5%. These companies operate fee-based pipeline assets, terminals, and have varying degrees of exposure to NGLs. On a total returns basis, all three of these companies have benefited from the rally in the energy space (primarily due to Putin invading Ukraine and effectively breaking the global energy supply chain) and as a result have creamed the S&P500 YTD and during the 2022 bear market:
Utility companies Sempra (SRE) and Southern Company (SO) round out the top-10 and yield 2.7% and 3.4%, respectively.
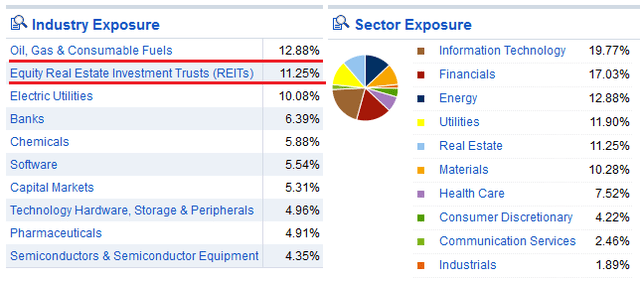
From an overall portfolio composition perspective, the FDVV ETF is over-weight in oil & gas and REITs, while the largest sector exposure is to the IT & Financials sectors:
Fidelity
Note the energy sector is currently estimated to be ~4.25% of the S&P500 as determined by the SPDR Energy ETF (XLE), so the FDVV ETF has about 3x weighting in energy as compared to the S&P500.
At 11.25%, the FDVV ETF is even more heavily over-weight the REIT sector: the SPDR Real Estate ETF (XLRE) equates to only 2.88% of the S&P500.
Valuation Metrics
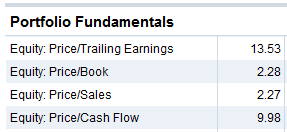
The primary valuation metrics of the FDVV fund are shown below:
Fidelity
Note the FDVV ETF trades at a significant discount to the S&P500 in terms of P/E (13.5x vs 21.3x), price-to-book (2.3x vs 4.2x), and price-to-sales (2.3x vs 2.6x). This “value” discount is likely due to the portfolio’s overweight in relatively low-valuation sectors like energy, REITs, and utilities. Which is also, of course, why FDVV’s 3.2% yield is more than double the yield of the S&P500’s (1.5%).
Performance
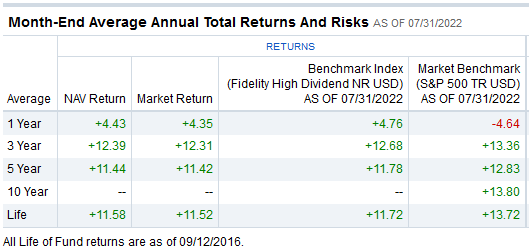
The chart below shows the FDVV ETF’s performance since inception:
Fidelity
Source: FDVV Performance Webpage
Note that FDVV under-performs Fidelity’s own High Dividend Benchmark. The chart below compares the price returns over the past 3-years (i.e. part bull & part bear markets) of the FDVV ETF in comparison to two competitors in the dividend sector: the Vanguard High Dividend Yield ETF (VYM) and the Schwab US Dividend Equity ETF (SCHD):

The SCHD price appreciation beats the FDVV ETF by ~12.5% while its dividend yield is currently ~0.4% lower (SCHD currently yields 2.8%).
Risks
The risks of the FDVV ETF are the same as most equity investments these days: inflation, prospects for higher interest rates, covid-19 related shut-downs and supply chain disruptions, and the potential for a global economic slow-down due to Putin’s horrific war-of-choice and invasion of Ukraine with that effectively broke the global energy and food supply-chains. That said, the FDVV’s over-weight allocation to the energy sector has protected investors during the subsequent bear market. However, given the very strong performance of the energy holdings in the FDVV portfolio, and their weight, combined with Apple’s recent run higher, the rest of the portfolio appears to be significantly pulling down overall returns.
Summary & Conclusions
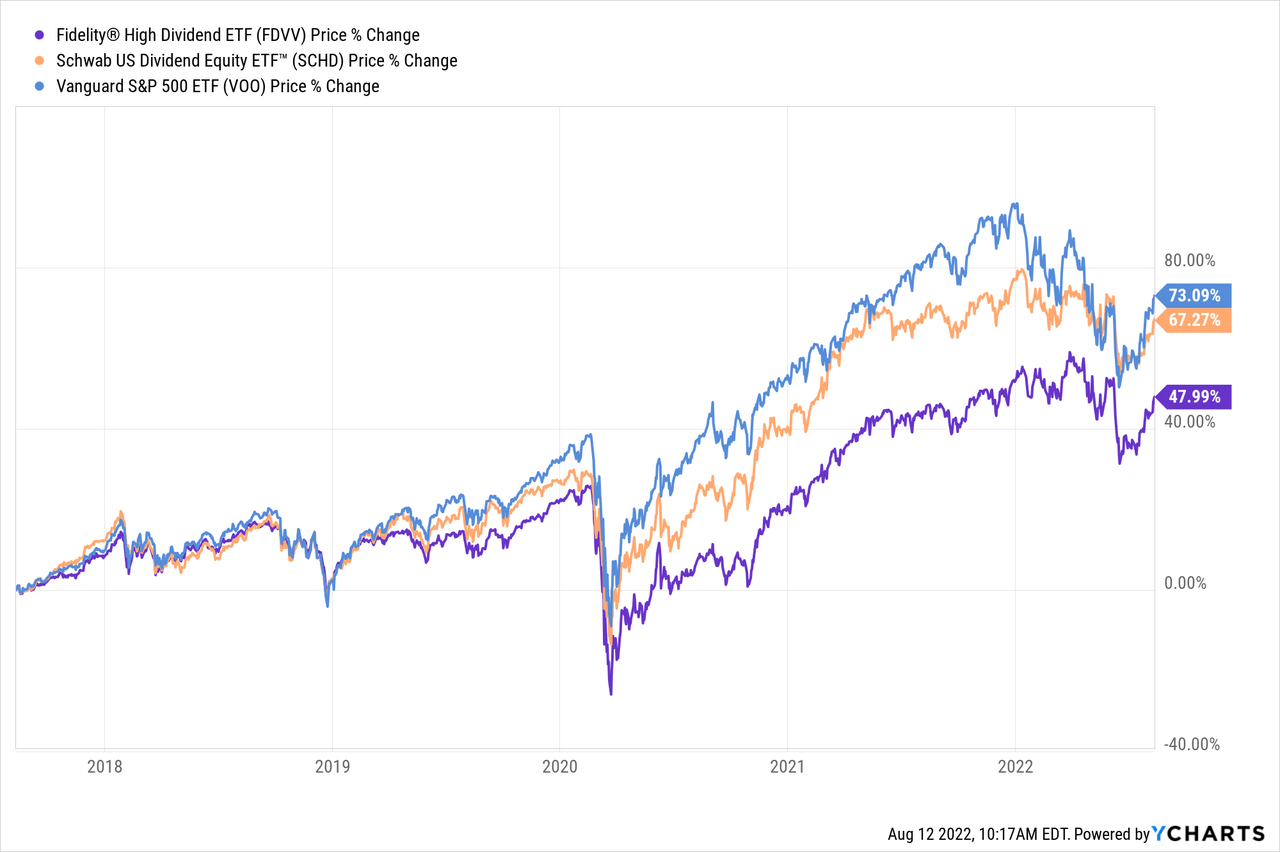
Given the FDVV ETF’s over-weight in energy stocks that have done very well over the past year, I expected its performance to be significantly better than demonstrated. While FDVV’s yield is ~0.4% higher than the SCHD ETF, the capital appreciation component has lagged – partly because SCHD has a significantly lower expense fee than FDVV (0.06% vs 0.29%). That is likely because SCHD is a US centric fund and FDVV has a 6.5% international component, and that typically trading international stocks typically increases a fund’s management costs. Regardless, for investors looking for dividend income, the SCHD ETF appears to be a superior choice over the FDVV ETF.
I’ll end with a chart comparing the 5-year returns of FDVV, SCHD, and the S&P500 as represented by the Vanguard S&P500 ETF (VOO) and point out that while the FDVV fund has led the pack YTD during this year’s bear market, the other two have significantly outperformed FDVV over the longer term.
[ad_2]
Source links Google News

