")
[ad_1]

Russian Labo/iStock via Getty Images
The iShares Fallen Angels USD Bond ETF (NASDAQ:FALN) invests in corporate bonds that have been downgraded by credit rating agencies to below investment grade. The attraction of this segment is based on the idea that bonds will sell off in anticipation of the downgrade beyond their underlying fundamentals resulting in potentially attractive relative value in the “fallen angels” that can outperform going forward.
That being said, it’s been a painful year for the bond market amid rising interest rates and macro concerns. The FALN ETF has declined by 12% year-to-date, underperforming high-yield bonds in general and we still see risks tilted to the downside. The key here is to watch credit spreads that have been otherwise resilient but could widen into deteriorating economic conditions. By this measure, we maintain a cautious approach towards high-yield corporate bonds and fallen angels with an expectation of further volatility.
What is the FALN ETF?
The FALN ETF tracks the “Bloomberg US High Yield Fallen Angel 3% Capped Index”. According to the methodology, bonds that have had their credit ratings downgraded to below investment grade ((Ba1/BB+ or lower)) by at least one of the major rating agencies, are eligible for inclusion during a monthly rebalancing. Individual corporate issuers are limited to a 3% weighting within the index and ETF. Other inclusion criteria include a minimum 1-year to maturity along with an outstanding face value of issuance of at least $150 million.
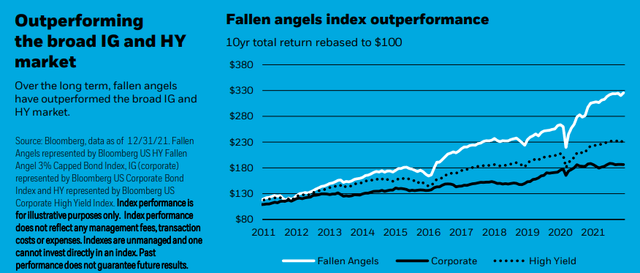
There is academic research suggesting fallen angels of the bond market offer higher long-term risk-adjusted returns, outperforming following their downgrade. This is evident comparing the performance of FALN with the iShares iBoxx $ High Yield Corporate Bond ETF (HYG) which is a benchmark for high-yield bonds. Since FALN’s fund inception date in 2016, the fund has returned a cumulative 43% which compares to 24% from HYG. Historical index data going back several decades confirms this dynamic, outperforming over the last decade.
source: iShares
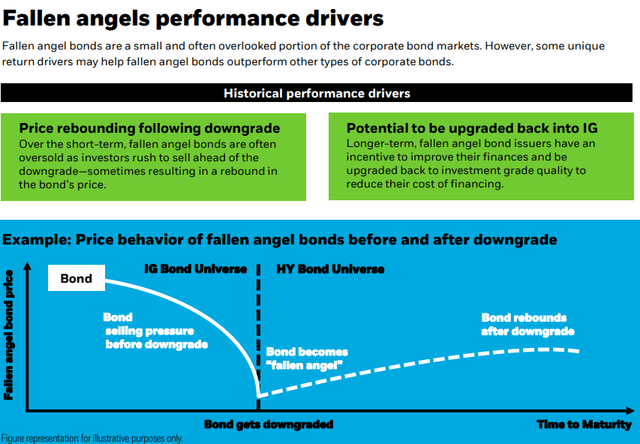
One explanation is a noted “fallen angel technical effect” where some investors are required to sell non-investment-grade bonds based on their strategy mandate. This forced selling can detach bond pricing from their actual financial position and credit metrics. The price appreciation potential of fallen angels may be attributed to bonds being oversold as they are downgraded only to recover as their credit conditions stabilize. Data from iShares shows that within six months of entering the index, fallen angel bond prices tend to recover to levels from six months before entering the index.
Secondly, fallen angel bonds can also represent a contrarian view. By the time bonds from a sector are downgraded, typically based on historical financials and earnings data, the market may already be looking ahead toward the recovery.
Finally, there is also the aspect that fallen angels offer relatively higher credit quality compared to other junk bonds. Since fallen angels started off as investment grade, these bonds are on average coming from a structurally stronger position compared to bonds that were initially issued at high yield.
source: iShares
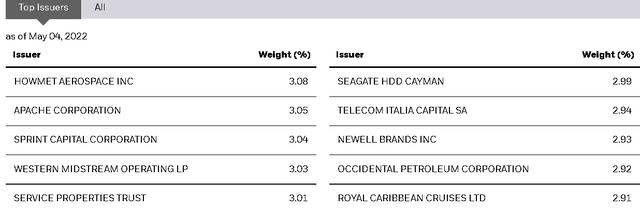
FALN portfolio
The current FALN portfolio is comprised of 291 bonds including several issuances from the same company. Energy sector corporates represent the largest weighting by sector at 22% in the portfolio. Bonds from companies like Occidental Petroleum (OXY) and Apache Corporation (APA) are notable fallen angels, getting a downgrade in 2020 during the early stages of the pandemic oil crash.
source: iShares
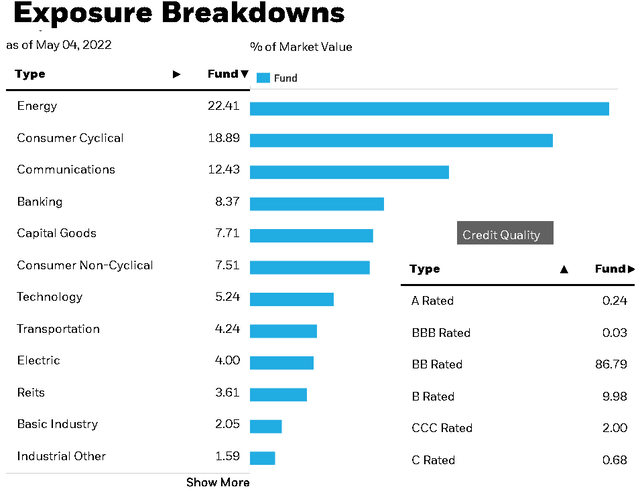
The energy sector exposure is interesting considering it has outperformed into stronger oil and gas prices working to support credit conditions within the sector. On the other hand, the environment is worse for the rest of the portfolio including 19% weighting in consumer cyclical sector bonds that are being pressured currently by high inflation and concerns of slowing growth adding questions to the forward outlook.
By credit quality, over 86% of the fund is within “BB-rated” bonds, or equivalent, which is the first level below investment grade. Finally, we also noted that the maturity profile is tilted towards the short to intermediate term with over 60% of the bonds maturing in under seven years with the effective duration listed at 5.6 years. This means that FALN has average sensitivity to changes in market interest rates.
source: iShares
The fund pays a monthly distribution that is variable based on the underlying portfolio income, and the timing of the corporate coupon payments schedule. The current yield on a trailing twelve months basis is listed at 3.9% although the SEC 30-day yield which normalizes based on the more recent payouts suggests a higher yield closer to 5%.
FALN performance
Despite the data showing FALN has outperformed other bond market segments historically, 2022 has thus far been an exception. FALN is down by 12% compared to a 9% decline in HYG as a high-yield bond market proxy.
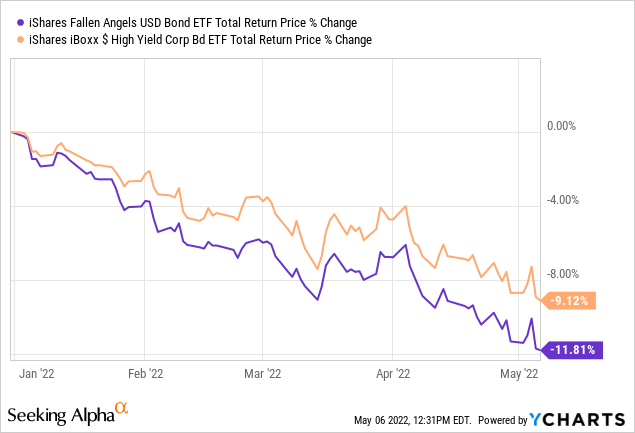
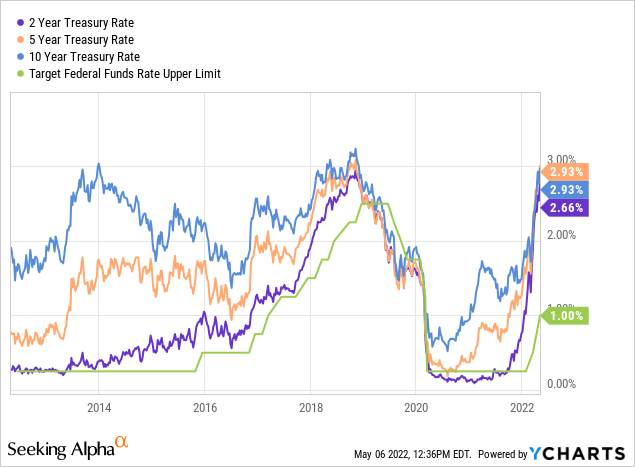
The first point to consider is the trend in market interest rates, sharply higher this year across the maturity curve. Persistently elevated inflation has surprised to the upside forcing the Fed to tighten credit conditions as a major development. Beyond the two recent Fed rate hikes, Treasuries have trended towards a decade high including the 10-year bond yield currently at 3%. Naturally, as interest rates rise, bond prices fall explaining much of the weakness in corporate bonds this year.
The other component of bond pricing is the changes in credit spreads which reflect the additional risk beyond Treasuries. While spreads have increased from lows in 2021, conditions are still strong even among high yield and considering the weakness inequities. At this point, the direction credit spreads go from here will have important implications on the forward outlook of the FALN ETF and high yields bonds which we discuss in more detail further below. The takeaway here is that the selloff in high-yield corporates and the FALN ETF this year has thus far been all-in-all controlled.
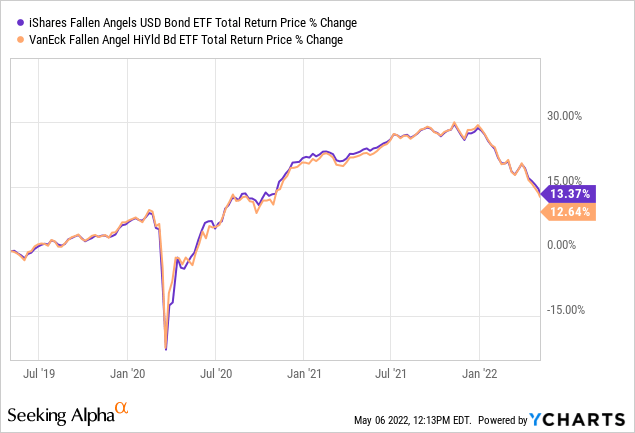
It’s also worth noting that FALN shares a similar strategy and exposure as the VanEck Fallen Angel High Yield Bond ETF (ANGL). While the actual underlying tracking indexes are different, both ETFs have a very similar performance history with a slight advantage to FALN returning 13.4% over the last 3-years compared to 12.6% by ANGL. FALN is our pick being the two based on a marginally lower expense ratio at 0.25% compared to 0.35% in ANGL. FALN is also a larger fund with $3.4 billion in assets under management meaning it’s more liquid for trading purposes.
FALN price outlook
The challenge for FALN and high-yield bonds is the uncertainty regarding the macro outlook. As mentioned, the corporate bond market has been relatively stable, supported by the economic momentum from 2021 and strong earnings over the last few quarters. The strength in the energy sector which traditionally plays a large role in high-yield has also supported broader credit conditions. This is a double-edged sword because some energy sector names may ultimately be upgraded back to investment grade and fall out of the index. This would end up hurting the profile of fallen angels as it loses out on its top performers.
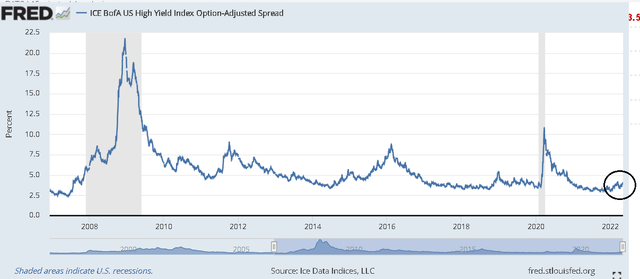
The chart below shows the current high-yield index “option-adjusted spread”. This is an indicator tracked by the Fed which we use as a proxy for junk bond credit conditions. A higher spread can be interpreted as the market demanding a higher yield to hold risky bonds above corresponding risk-free Treasuries. The takeaway is that the current level of 4%, while up from a low of 3% in 2021, remains at a historically narrow level. The index climbed above 8% several times over the last decade and climbed as high as 21% during the last financial crisis.
The point we are getting at here is that if there is any scenario that the economy is rolling over into a recession that would be defined by an increasing number of high-yield bond defaults and corporate bankruptcies, we can expect credit spreads to significantly widen from the current levels.
source: Federal Reserve Bank of St. Louis
If credit conditions deteriorate materially, the door would be open for even larger losses in high-yield bonds and the FALN ETF going forward. In our view, it’s a mistake to look at the FALN ETF price chart and assume that since it’s well-off the highs, the bond segment is cheap or undervalued.
To the upside, the bullish case for FALN is going to need a few things to happen. First, stability in long-term interest rates or at least a pullback in yields lower will be critical for bonds to gain momentum with the improved sentiment. At the macro level, we want to see signs inflation is peaking and hopefully begins to trend lower with indications the economy can continue to grow even as the Fed continues its rate hiking cycle.
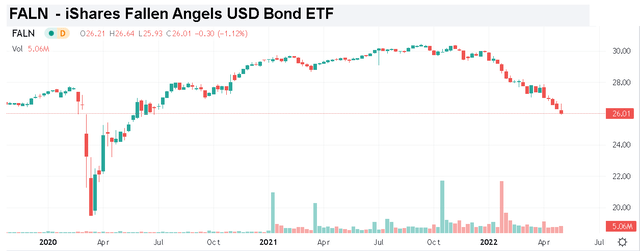
Seeking Alpha
Final thoughts
There’s a lot to like about FALN which represents a compelling bond investing strategy that has outperformed over the long run. The iShares Fallen Angels USD Bond ETF is a good option to add diversification to fixed-income holdings. As it relates to the near-term outlook, we see the current environment as high-risk for junk bonds which are up against both rising interest rates and credit pressures.
[ad_2]
Source links Google News