")
[ad_1]
The year was 1962. American singer-songwriter Tim Paxton released his latest album with a short, 1:47 jingly tune named “My Dog Is Bigger Than Your Dog.” While not really a huge hit like other Paxton folk anthems, it became the basis for a very successful 1960s dog food TV commercial campaign for Ken-L Ration by Quaker, and rivaled other jingles of the day, such as the Oscar Mayer baloney and Rice-a-Roni. Investors in traditional S&P 500 Index ETFs should take heed of other competitive dogs.

Bigger is not necessarily better
While not usually a huge fan of general index ETFs, the Equal Weight S&P 500 as offered by Invesco is the exception. I like my ETFs to generate investor exposure that is either hard to replicate or in industries where disruptive technologies abound. For example, I own Global X Founder-Run Companies ETF (BOSS) for its focus on public companies still managed by their founding fathers. BOSS sector composition is 36% technology, 14% each consumer cyclical and real estate, and 12% healthcare.
There are several maturations of the same 500 stocks in the S&P 500 index. The most popular is the SPDR S&P 500 Trust ETF (SPY) which is a capitalization-weighted ETF, just like the underlying index. There are also equally weighted ETFs, when the index components are included based on each stock having the same weighting. Invesco S&P 500 Equal Weight ETF (RSP) is the largest S&P 500 equal-weighted ETF. 18 months ago, Exponential ETF began offering a reverse S&P 500 weighting, Reverse Cap Weighted U.S. Large Cap ETF (RVRS), where each stock is represented in the reverse of its index weighting. RVRS assigns the largest ETF weighting to the benchmark’s smallest companies.
The granddaddy SPY was founded by State Street (STT) on Jan 23, 1993, and, as of March 31, has $264 billion of assets under management (AUM). Invesco (IVZ) began offering its equal-weighted RSP on April 30, 2003, and has $15.7 billion in AUM. Exponential ETF began offering its reverse-weighted RVRS on Oct. 31, 2017, and has managed to attract $9.0 million in AUM. Take your pick – cap-weighted, equal-weighted, or reverse-weighted. They all own the same portfolio of companies, just in different amounts. However, their performance is quite different.
While RVRS has a short trading history, SPY and RSP offer histories sufficient to compare performance over the longer term. The charts below from dividendchannel.com compares the difference in total returns and stock price only returns of SPY and RSP going back to 2003.
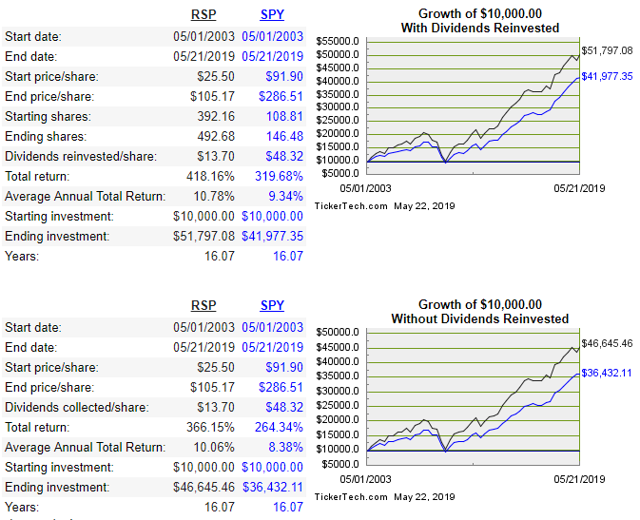
While some may say the difference is no big deal, 10.8% total annual return with dividends reinvested for RSP vs. 9.3% for SPY. However, as outlined, the difference is an extra $9,820, or 23% over the previous 16 years with dividends reinvested and an extra $10,213, or 28%, if dividends were not reinvested. On March 17, 2009, I suggested my son-in-law invest $87 shy of $10,000 ($9913) in his traditional IRA in RSP at $23.49, along with a few other choices that day. Luckily for him he did, and still owns the original 422 shares. These shares are now valued at $51,446 (no reinvestment of dividends) for annual total return of 17.5% vs. 15.9% for a similar investment in SPY.
With a substantially shorter trading history, RVRS performance looks similar to RSP. Since Nov. 1, 2017, RVRS has generated a total return of 7.3% vs. 7.45% for RSP and 7.9% for SPY, no reinvestment of dividends.
What explains the return difference between SPY and its equal-weighted cousin? It’s the portfolio’s weighting of its individual components – pure and simple.
Market capitalization-weighted indexes weight their securities by market value as measured by capitalization: that is, current security price times number of outstanding shares. In cap-weighted indexes, names are added and deleted based on the actions of the index providers. In 2017, there were nineteen deletions and additions to the index, in 2018 twenty-three changes and so far in 2019, five stocks have been replaced. In an equal-weighted index, all securities in the basket are weighted in equal amounts. However, unlike the market-cap indexes, equal-weight ETFs will re-balance on a schedule so that at the end of the re-balance, all stocks have the same weighting.
In a cap-weighted index, changes in the market value of larger securities move the index’s overall trajectory more than those of smaller ones. Usually, those stocks being replaced are either merger-related, and no long are independent, or are proven losers and it’s time to get rid of them. For example, between Jan. 2017 and March 2019, 31 stocks were deleted from the SPY due to mergers and 20 were deleted due to “market capitalization changes.” The SPY index has a minimum market capitalization, and most of those deleted due to market cap changes usually mean share prices have fallen below the minimum to be included in the index, currently at $6.1 billion.
The act of quarterly re-balancing of an equal-weighted portfolio means that component relative winners are sold, and relative losers are bought. The quarterly re-balancing will effectively increase the number of shares of under-performers and reduce the number of shares of top performers – sounds like buy low and sell high. Some may believe RSP’s outperformance is based on having a larger portion in smaller cap stocks, its implementation could be influenced more by “value” than “market cap size.”
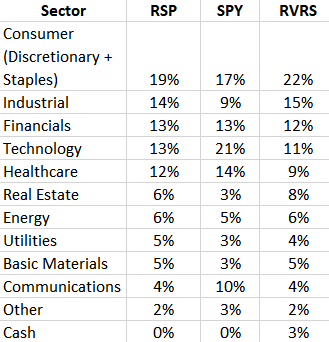
Looking at the current composition of the sector exposures of SPY, RSP, and RVRS also unveils a few stark differences in portfolios. After combined consumer discretionary and staples, cap-weighted SPY offers a higher exposure to technology and communications while equal-weighted RSP offers more exposure to industrial and real estate. The top five sectors (consumer, industrial, financials, technology, healthcare) for RSP comprised 71% of assets while for SPY the top five comprise 74%. Below is a table of sector allocations, as of May 22, from etfdb.com:
ETF fees are minimal, ranging from 0.09% for SPY, 0.20% for RSP, and 0.29% for RVRS.
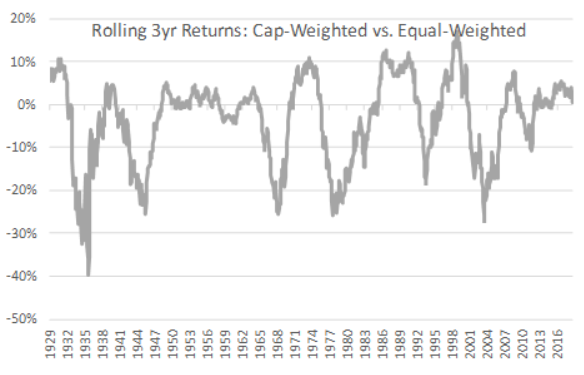
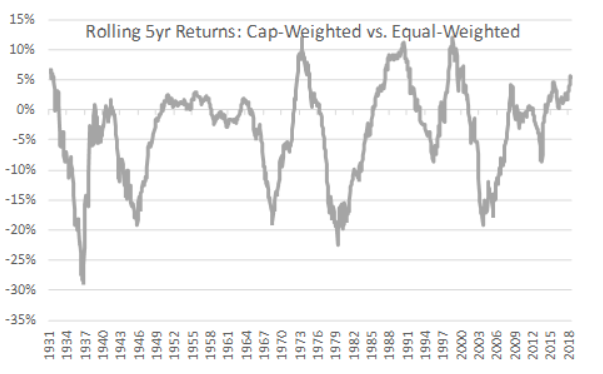
However, RSP’s out-performance is not a straight-line graph. Sometimes market-weighting will outperform and sometime equal-weighting will outperform. SA contributor Ploutos published a very interesting article on the rolling returns of market- vs. equal-weighted portfolios, going back to 1926. Below are 3-yr and 5-yr rolling return charts, using the formula capitalization-weighting returns minus equal-weighting returns. When cap-weightings outperform, the graph shows positive and when equal-weighting outperforms, the graph shows negative.
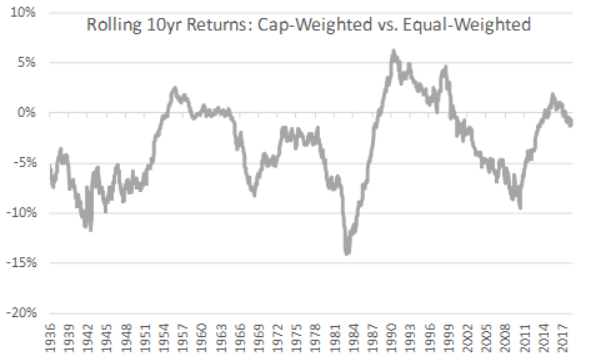
From the article:
- Over rolling three-year periods, equal-weighting outperformed capitalization-weighting about 55% of the time.
- Over this long data set [5-yrs], equal-weighting bested capitalization-weighting around 60% of every rolling five-year period.
- Equal-weighting produced absolute positive returns for each rolling 10-yr period and outperformed capitalization-weighting about 75% of the time.
Ploutos sums up his findings:
In Why Does an Equal-Weighted Portfolio Outperform Value and Price-Weighted Portfolios, authors Yuliya Plyakha, Raman Uppal, and Grigory Vilkov confirmed in 2012 that “that the equal-weighted portfolio outperforms the value- and price-weighted portfolios partly because of its higher exposure to the market, size, and value risk factors.” The authors also added that equal-weighting generates alpha, “whose source is the portfolio’s monthly rebalancing that takes advantage of reversal, idiosyncratic volatility, and the lead-lag characteristics of stock returns at the monthly frequency.”
When deciding to take the passive investing route via index ETFs, it is important the structure of the portfolio is carefully evaluated and fully understood. The composition and structure of the portfolio are as important as the index chosen.
I have been a long-term holder of RSP since 2006, adding only very infrequently. I also use RSP as my “market” indicator as I believe it is more representational of the underlying movements of the stock market. As a conservative investment in the portfolio asset classification of “bought primarily for capital gains,” RSP should be a core holding for just about every portfolio and should be preferred over its much larger competitor, SPY.
Enjoy, and thanks for reading.
Author’s Note: Please refer to my profile for the required disclosures.
Disclosure: I am/we are long RSP, BOSS. I wrote this article myself, and it expresses my own opinions. I am not receiving compensation for it (other than from Seeking Alpha). I have no business relationship with any company whose stock is mentioned in this article.
[ad_2]
Source link Google News