[ad_1]

tum3123/iStock via Getty Images
During Q4 2021, the Global X Emerging Markets Bond ETF (EMBD) sub-advised and actively managed by Mirae Asset Global Investments (USA) LLC, recorded a total return of -0.59%. The Fund modestly underperformed the -0.22% return of the fund’s benchmark, the JPMorgan EMBI Global Core Index (the “Index”) over the same period. The Index tracks liquid, US dollar emerging market (EM) fixed and floating-rate debt instruments issued by sovereign and quasi-sovereign entities.
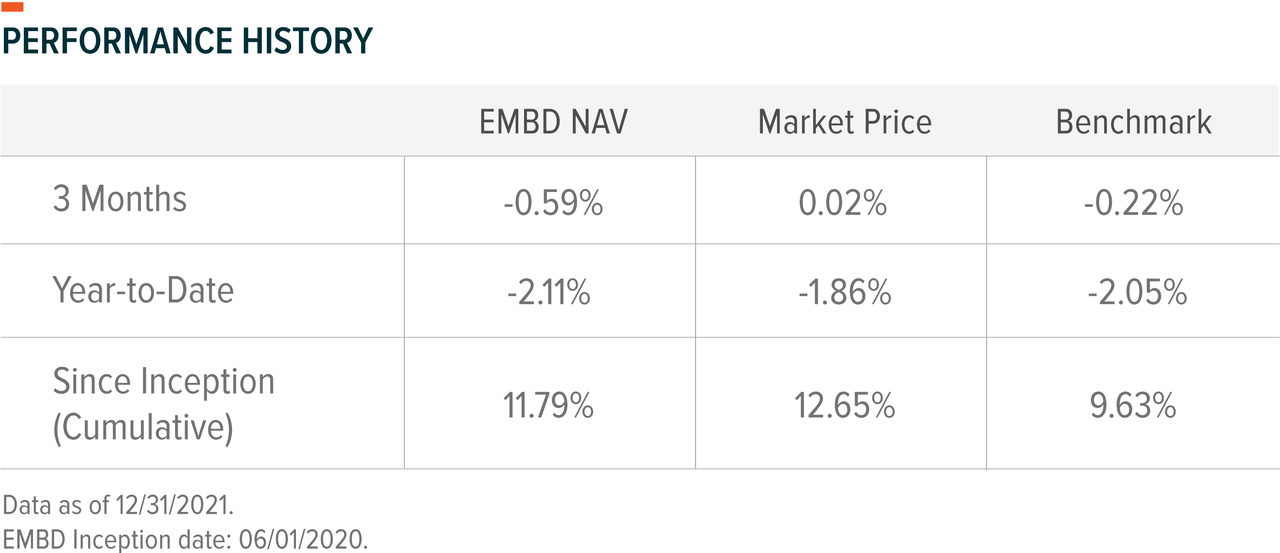
The performance data quoted represents past performance and does not guarantee future results. Investment return and principal value of an investment will fluctuate so that an investor’s shares, when sold or redeemed, may be worth more or less than their original cost. Current performance may be higher or lower than the performance quoted. For performance data current to the most recent month or quarter-end, please click here. Total expense ratio: 0.39%.
Cumulative return is the aggregate amount that an investment has gained or lost over time.
General Market Review
The spread of the Omicron variant reduced global growth expectations in the quarter, as policymakers imposed travel restrictions to counter rising COVID-19 cases. China’s zero-tolerance approach to COVID-19 dampened the prospect of a speedier recovery to supply-chain bottleneck challenges across the global economy. Furthermore, China’s policy-induced slowdown continued as property market concerns negatively impacted domestic consumer sentiment. But the spike in inflationary pressure was the most relevant driver to changes across the broader investment landscape. The inflation overshoot led to social unrest and political liability for developing nations and the US. As politicians head into 2022 US mid-term election, the US Federal Reserve (Fed) announced hawkish policy plans to speed up tapering, signaling a faster normalization process. Despite the hawkish policy by the Fed, market liquidity continued to expand during the period causing the Fed’s overnight reverse repo facility to increase to $1.9 trillion, which had a near-zero balance at the beginning of the year.
As for the emerging markets, macro headwinds persisted as Chinese economic growth decelerated due to policymakers’ deleveraging policies. However, that trend abruptly changed in early December as the government pivoted its policy towards growth stability during China’s Central Economic Work Conference. EM cyclical securities within the fixed income sector that are usually sensitive to China’s growth had a more muted response. Investors appeared to prefer taking a wait and see approach towards policymakers’ actions. Additionally, supply-side shocks and the energy price overshoot in the third quarter further deteriorated EMs’ growth-inflation mix causing social unrest. Consequently, financial liquidity conditions in most EMs became poorer even as the US National financial condition index (NFCI) hit an all-time high driven by the Fed’s ongoing quantitative easing program. The Fed’s hawkish policy stance likely added pressure to EM financing conditions as well.
The emerging sovereign debt market posted a loss of -0.10% during the period, while the emerging corporate debt sector declined by -2.09%.1 Higher continuous inflation numbers led the Fed to strengthen its hawkish policy stance. However, instead of driving the US 10-year Treasury rate higher, the 10-year rate remained flat. In contrast, the 2-year rate, which is more sensitive to the Fed’s interest rate policy, rose 45 basis points, resulting in aggressive yield curve flattening. The US 30-year Treasury rate fell more than 15 basis points during the period supporting higher quality long duration securities. Consequently, the investment grade sector, which is higher in duration and credit quality, outperformed the high yield sector during the period.2
Investors actively de-risked credit portfolios to adjust to the deteriorating trading environment for EM fixed-income, leading to higher quality EM debt outperforming. Another critical investment theme prevalent during the quarter was the rising political risk premium within the EM sovereign fixed income market. The Latin American region, which had a busy political election cycle in 2021, saw a significant shift in the political landscape toward left-leaning governments. This political shift signals risks of a deteriorating institutional framework that long-term EM investors greatly value. For example, El Salvador sovereign bonds were the worst-performing EM debt market, as President Bukele adopted bitcoin as legal tender, potentially risking its foreign reserves in the cryptocurrency market. In the fourth quarter, heightened geopolitical and sanction risk premiums also negatively impacted the EM sovereign market. Ukraine notably underperformed due to elevated geopolitical tensions with Russia. Interestingly, as was the case in the third quarter, the higher commodity prices did not support credit spreads for commodity-exporting sovereigns in the fourth quarter.
The emerging corporate debt market underperformed the sovereign debt market again this quarter. The adverse developments in China’s property market continued with the liquidity crisis spreading to higher-quality Chinese property developers. Outside of China, Latin American and Turkish corporate issuers experienced a significant rise in credit spreads driven mainly by the heightened political risk premiums. Even as corporate earnings grew substantially, issuers maintained a cautious balance sheet strategy by reducing the net debts and extending the maturity profile to take advantage of accommodative funding conditions. The mining and metals sector outperformed the EM corporate debt index as higher commodity prices were a tailwind.3
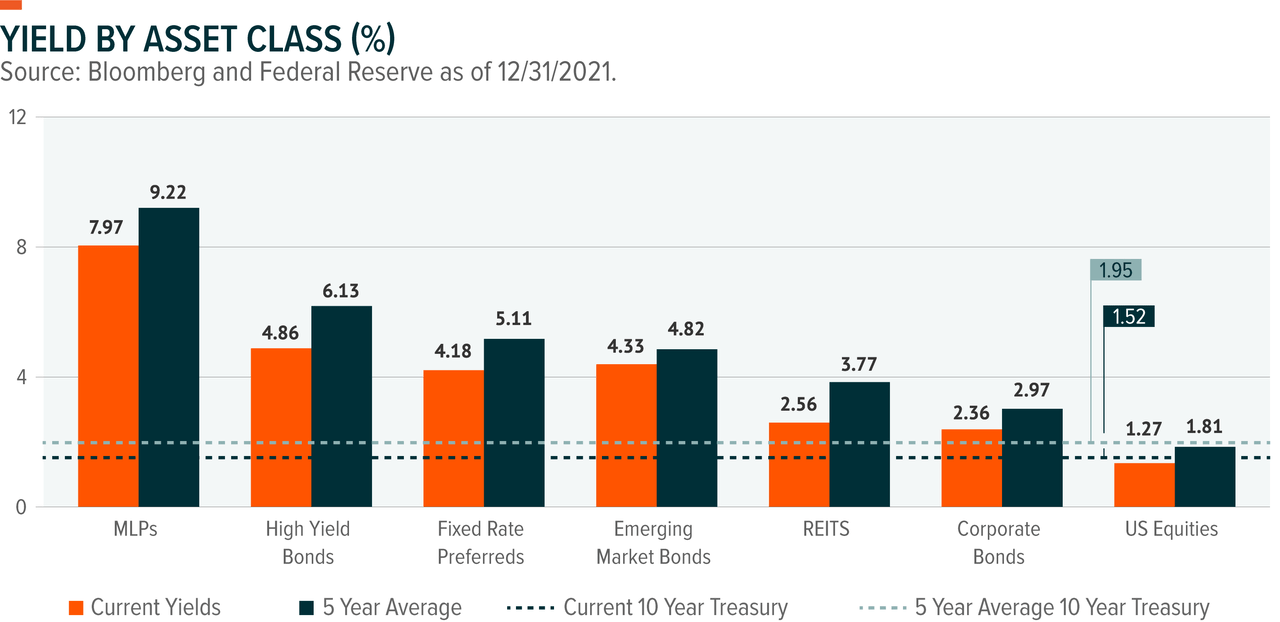
Note: Asset class representations are as follows, MLPs, S&P MLP Index; High Yield Bonds, Bloomberg US Corporate High Yield Total Return Index; Emerging Market (EM) Bonds, Bloomberg EM USD Aggregate Total Return Index; Corporate Bonds, Bloomberg US Corporate Total Return Index; REITs, FTSE NAREIT All Equity REITs Index; Equities, S&P 500 Index; and Fixed Rate Preferreds, ICE BofA Fixed Rate Preferred Securities Index. The performance data quoted represents past performance and does not guarantee future results.
EMBD Portfolio Attribution
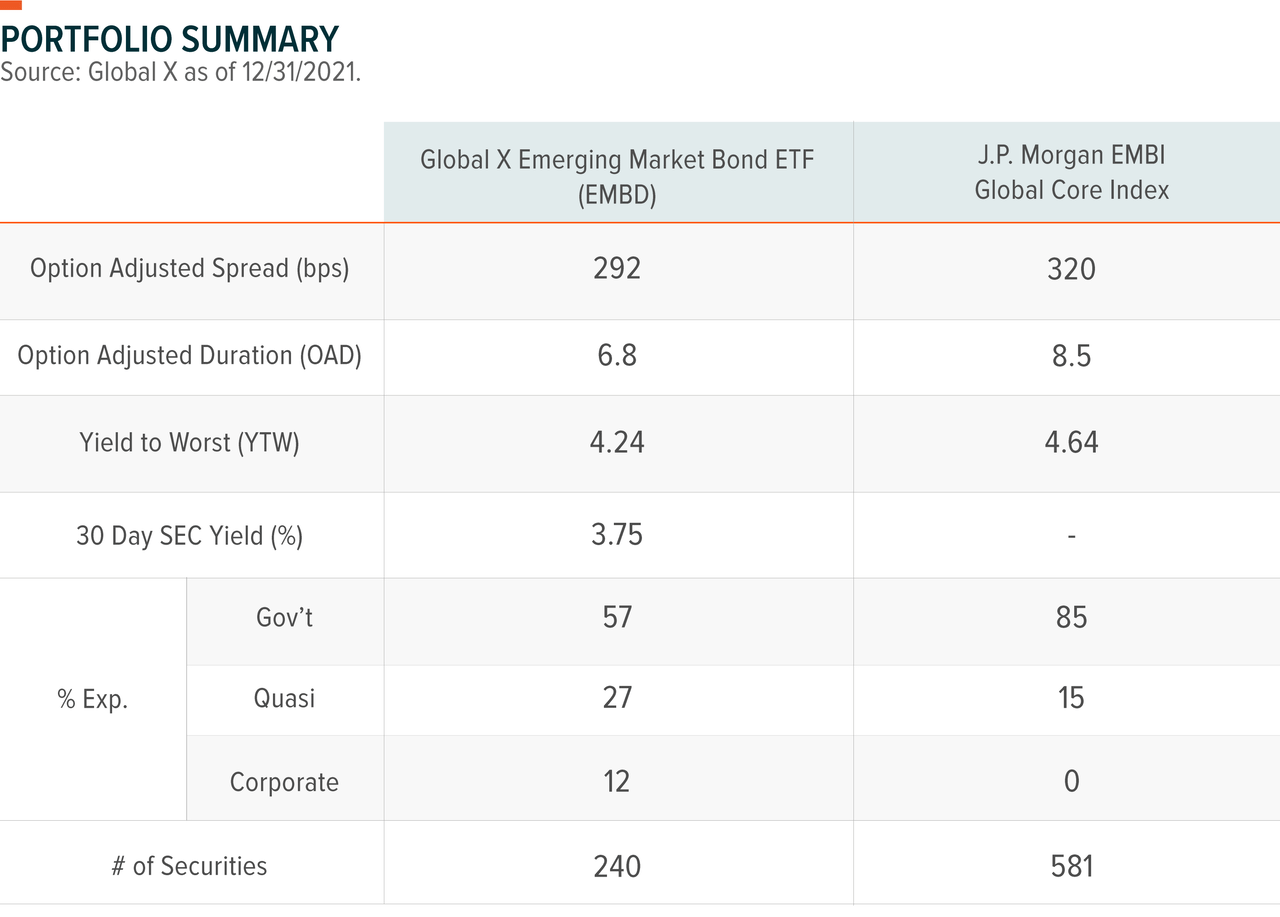
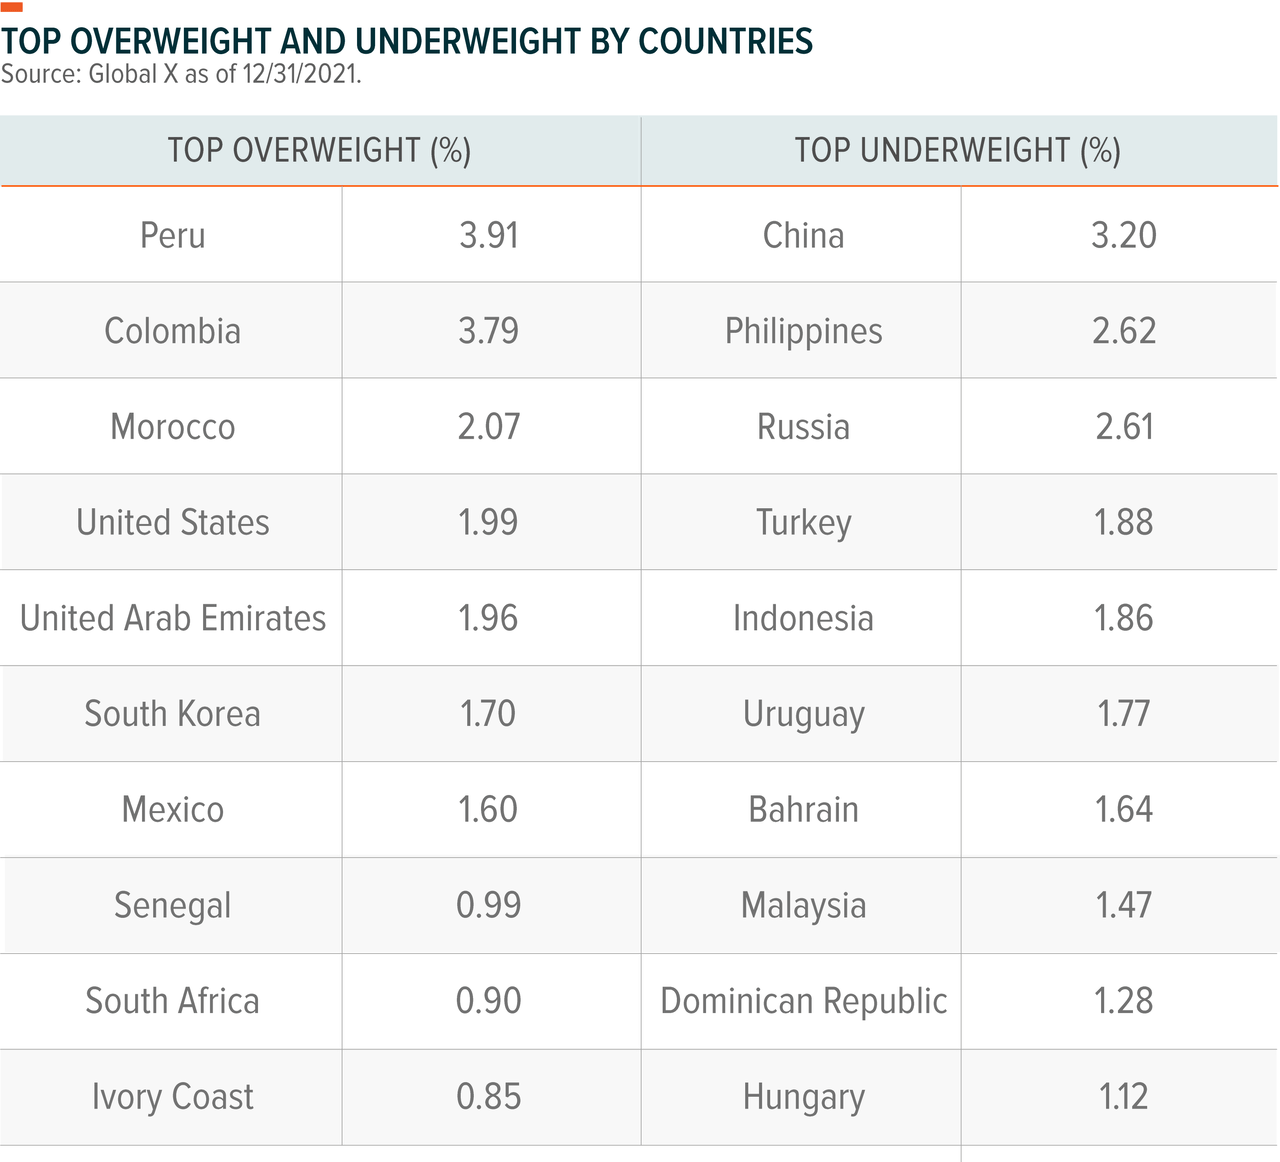
During the period, the Fund underperformed the Index by 37 basis points. The Fund’s lower duration relative to the index was the main detractor to performance (-19 basis points). Also, Fund’s security selections, mainly in corporate issuers, detracted from performance (-16 basis points) but was offset by positive contributions from country selections. Heading into the fourth quarter, we maintained our underweight duration exposure while tilting the portfolio to pro-cyclical and higher growth-sensitive issuers in high-yielding sectors, which ended up hurting performance.
Our high beta long exposures in pro-cyclical sovereigns such as Egypt detracted from performance. Egypt continued to surprise investors with a willingness to tap the market to support an expansionary fiscal policy which fueled investors’ to question Egypt’s growing debt sustainability. Furthermore, our long position in Colombia negatively contributed to performance as our decision to build a long position soon after S&P downgrade the country’s credit rating proved too early. On the other hand, our underweight positions in distressed and defaulted sovereigns such as Lebanon and Sri Lanka positively contributed to performance. Our security selections in Brazil, namely in e-commerce retailer issuers, detracted from performance as supply disruptions and higher inflation dynamics negatively impacted retailers highly sensitive to domestic economies. The Fund did not have any exposure to Chinese property developers during the period as we believe there were too many uncertainties related to regulations to enter any positions.
Q1 Outlook & Positioning
The critical investment thesis heading into 2022 will be how well the financial markets respond to a more aggressive Fed as it shifts its focus on re-anchoring consumer and industrial inflation expectations. Global growth expectations are declining due to the Omicron variant, persistent inflation, and fading fiscal support. The latest announcement by the Fed to reduce the balance sheet quantitative tightening (QT) should be a new catalyst that requires the market to incorporate a higher volatility premium for 2022.
Aside from the need to adjust to a higher volatility environment, we have a more constructive view on growth stability and market liquidity. Even as the Fed plans to start its rate normalization path in the first quarter, we believe it will take most of 2022 before the market begins to notice any tightness in market liquidity. For instance, the excess liquidity parked at the New York Fed reverse repo facility amounted to more than $1.6 trillion in the first week of January and the Fed has indicated it will still inject liquidity into the system until March 2022. Regarding growth stability, Developed Market (DM) growth momentum has shifted lower, especially after the emergence of the Omicron variant. Still, our view is the economic recovery should be swifter considering that this variant is less severe.
Looking at EMs, we started to see gradual signs of improvements in China’s economic activity after bottoming out in the third quarter. From an EM liquidity perspective, it’s conventional to consider tightening Fed policy and higher US Treasury rates will lead to a stronger US dollar and therefore weaken the EM financing conditions. However, the experience in 2017 tells a different story. In that year, the Fed raised interest rates three times and initiated the first QT program, yet the US dollar declined by 12%. We believe the key drivers will be DM-EM growth differential improvements on the back of a stabilizing global growth recovery. That being said, we must closely monitor how well markets respond to a hawkish Fed as declining asset values can reduce market liquidity.
We anticipate the 10-year treasury yield to increase, backed by a rise in real yields. However, we believe the speed at which government bond yield gains will be a much more measured pace than what the market observed in the first quarter of 2021, given that the market will likely only tolerate higher yields to the extent that global growth momentum stabilizes.
Even though we are past the peak liquidity cycle, we expect the current levels of abundant liquidity in the financial system to support growth and carry assets. As a result, we believe investors will look to EM credit assets which should benefit from the global recovery (i.e. rising commodity prices) while offering carry income in a more volatile rate environment.
We maintain our view that global bond yields will move higher in the first half of the year, with EM credit spreads remaining elevated until the market fully re-adjusts to a hawkish Fed, before settling down. Therefore, we favor high-yielding assets over the investment-grade sector, given that there are more spread buffers to absorb in the high-yield sovereign bonds. That said, we believe credit differentiation driven by sovereigns with healthy external balance sheets will be the central theme for EM assets as the Fed withdraws liquidity supports from the system. We find the EM corporate sector offers attractive investment opportunities as corporate fundamentals continue to improve with the global recovery while managements have maintained a conservative strategy to strengthen balance sheets. We anticipate that market volatility will remain elevated as the Fed’s tightening policy, Omicron variant concerns, and the inflation trends may alter the growth trajectory.
Related ETFs
EMBD: The Global X Emerging Markets Bond ETF (EMBD) is an actively managed fund sub-advised by Mirae Asset Global Investments that seeks a high level of total return, consisting of both income and capital appreciation, by investing in emerging market debt.
Footnotes
Endnotes:
1. Data from 9/30/21 to 12/31/21. EM Sovereign represented by Bloomberg Sovereign EM Index, and EM Corporate represented by Bloomberg EM USD Aggregate Corporate Index.
2. Investment grade sector represented by Bloomberg US Aggregate Bond Index and high yield sector represented by Bloomberg US Corporate High Yield Index.
3. Mining and Metals sector represented by Bloomberg High Yield Metals & Mining Total Return Index
Definitions
Beta: Beta is a quantitative measure of volatility, also known as systematic risk, of a security or securities versus the market as a whole.
Duration: Is a measure of the sensitivity of the price of a fixed-income investment to a change in interest rates. Duration is expressed in years.
S&P MLP Index: Provides investors with exposure to the leading partnerships that trade on the NYSE and NASDAQ. The index includes both master limited partnerships (MLPs) and publicly traded limited liability companies (LLCs), which have a similar legal structure to MLPs and share the same tax benefits.
Bloomberg Sovereign EM Index: Tracks fixed, and floating-rate US dollar-denominated debt issued by EM governments.
Bloomberg EM US Aggregate Corporate Index: A flagship hard currency Emerging Markets debt benchmark that includes USD-denominated debt from sovereign, quasi-sovereign and corporate EM issuers.
Bloomberg US Corporate High Yield Total Return Index: Measures the USD-denominated, high yield, fixed-rate corporate bond market. Securities are classified as high yield if the middle rating of Moody’s, Fitch and S&P is Ba1/BB+/BB+ or below. Bonds from issuers with an emerging markets country of risk, based on the indices’ EM country definition, are excluded.
Bloomberg EM USD Aggregate Total Return Index: A flagship hard currency Emerging Markets debt benchmark that includes fixed and floating-rate USD dollar-denominated debt issued from sovereign, quasi-sovereign, and corporate EM issuers.
Bloomberg US Aggregate Bond Index: A broad-based flagship benchmark that measures the investment grade, US dollar-denominated, fixed-rate taxable bond market.
Bloomberg High Yield Metals & Mining Total Return Index: Measures the returns of leading mining and metals stocks in the world.
FTSE NAREIT All Equity REITs Index: A free float adjusted market capitalization weighted index that includes all tax qualified equity REITs listed in the NYSE, AMEX, and NASDAQ National Market.
Bloomberg US Corporate Total Return Index: Measures the investment grade, fixed-rate, taxable corporate bond market. It includes USD denominated securities publicly issued by US and non-US industrial, utility and financial issuers.
S&P 500 Index: Tracks the performance of 500 leading U.S. stocks and captures approximately 80% coverage of available U.S. market capitalization. It is widely regarded as the best single gauge of large-cap U.S. equities.
ICE BofA Fixed Rate Preferred Securities Index: Tracks the performance of fixed-rate U.S. dollar denominated preferred securities issued in the U.S. domestic market.
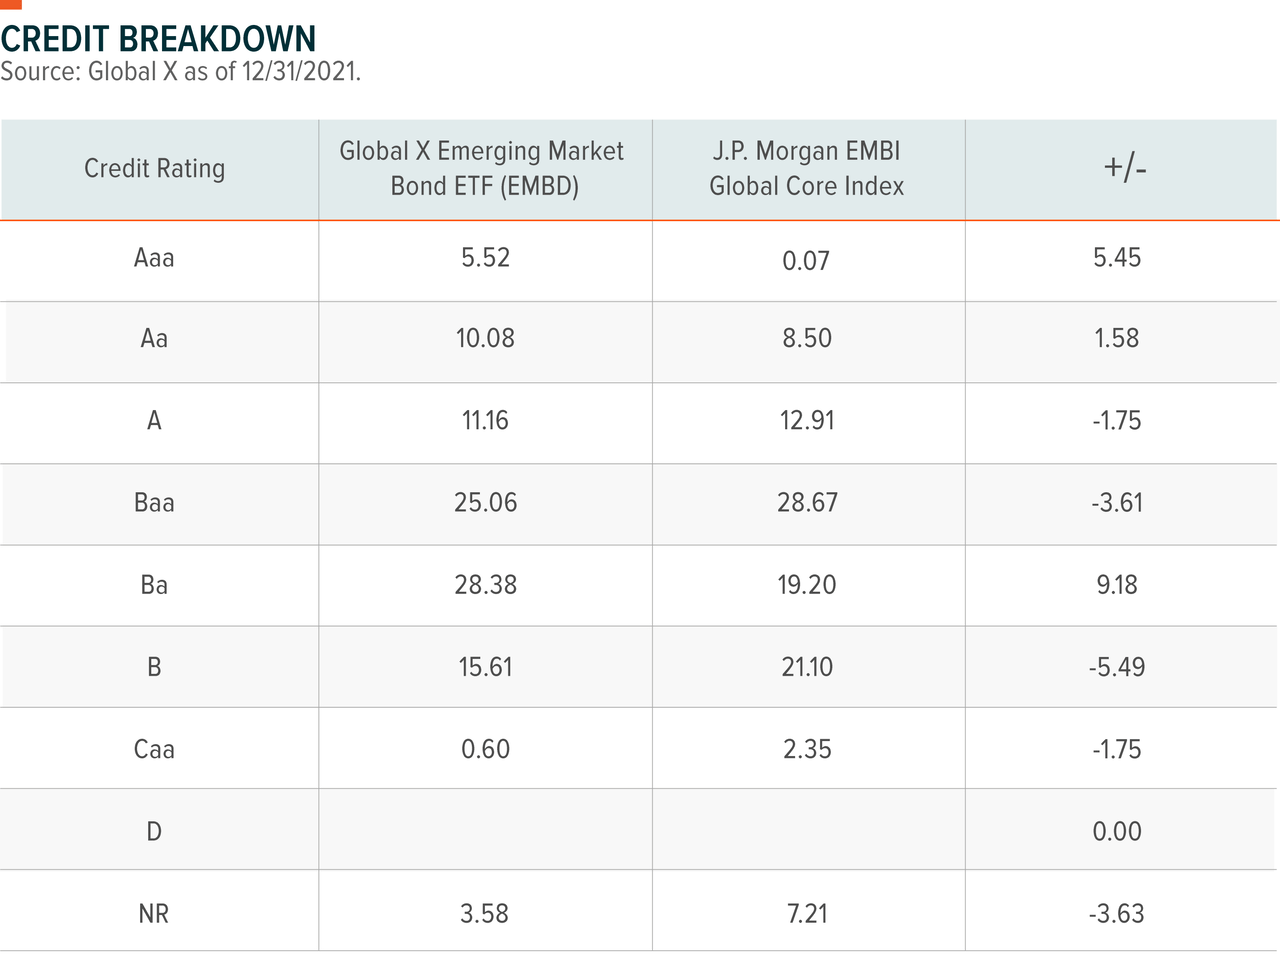
Credit Rating Agencies noted are Fitch, Moody’s, and Standard & Poor’s. Ratings are measured on a scale that generally ranges from Aaa (highest) to D (lowest). If more than one of these rating agencies rated the security, then an average of the ratings was taken to decide the security’s rating.
National Financial Conditions Index: Provides a comprehensive weekly update on U.S. financial conditions in money markets, debt and equity markets and the traditional banking systems.
Investing involves risk, including the possible loss of principal. International investments may involve risk of capital loss from unfavorable fluctuation in currency values, from differences in generally accepted accounting principles, or from economic or political instability in other nations. Emerging markets involve heightened risks related to the same factors as well as increased volatility and lower trading volume. High yield bonds involve greater risks of default or downgrade and are more volatile than investment grade securities, due to the speculative nature of their investments. EMBD is actively managed, which could increase its transaction costs (thereby lowering its performance) and could increase the amount of taxes you owe by generating short-term gains, which may be taxed at a higher rate. EMBD is non-diversified.
As an actively managed Fund, EMBD does not seek to replicate a specified index and is subject to increased credit and default risk, where there is an inability or unwillingness by the issuer of a fixed income security to meet its financial obligations, debt extension risk, where an issuer may exercise its right to pay principal on an obligation later than expected, as well as interest rate/maturity risk, where the value of the Fund’s fixed income assets will decline because of rising interest rates.
EMBD may invest in securities denominated in foreign currencies. Because the Fund’s NAV is determined in U.S. dollars, the EMBD’s NAV could decline if currencies of the underlying securities depreciate against the U.S. dollar or if there are delays or limits on repatriation of such currencies. Currency exchange rates can be very volatile and can change quickly and unpredictably.
Carefully consider the Fund’s investment objectives, risks, and charges and expenses before investing. This and other information can be found in the Fund’s summary or full prospectuses, which may be obtained by calling 1.888.493.8631, or by visiting globalxetfs.com. Please read the prospectus carefully before investing.
EMBD’s benchmark index is the JPMorgan EMBI Global Core Index, which is a broad, diverse U.S. dollar denominated emerging markets debt benchmark that tracks the total return of actively traded debt instruments in emerging market countries. Indices are unmanaged and do not include the effect of fees, expenses or sales charges. One cannot invest directly in an index.
This information contains a manager’s opinion, is not intended to be individual or personalized investment or tax advice, and should not be used for trading purposes.
Shares of ETFs are bought and sold at market price (not NAV) and are not individually redeemed from the Fund. Brokerage commissions will reduce returns. The market price returns are based on the official closing price of an ETF share or, if the official closing price isn’t available, the midpoint between the national best bid and national best offer (“NBBO”) as of the time the ETF calculates current NAV per share, and do not represent the returns you would receive if you traded shares at other times. NAVs are calculated using prices as of 4:00 PM Eastern Time.
Global X Management Company LLC serves as an advisor to Global X Funds. The Funds are distributed by SEI Investments Distribution Co. (SIDCO), which is not affiliated with Global X Management Company LLC or Mirae Asset Global Investments. Global X Funds are not sponsored, endorsed, issued, sold or promoted by JPMorgan, nor does JPMorgan make any representations regarding the advisability of investing in the Global X Funds. Neither SIDCO, Global X nor Mirae Asset Global Investments are affiliated with JPMorgan.
Original Post
Editor’s Note: The summary bullets for this article were chosen by Seeking Alpha editors.
[ad_2]
Source links Google News

