[ad_1]

Richard Drury/DigitalVision via Getty Images
The U.S. equity market has dramatically outperformed international indexes for many years. Investors who have diversified beyond the U.S. have underperformed those who just invested in the U.S. markets. Consider, for example, that the total return on NYSEARCA:EFA, the iShares EAFE ETF, is 2.92% per year over the past 15 years, as compared to 10.07% per year for SPY, which tracks the S&P 500. Since the EFA was launched in 2001, EFA’s annualized return is 5.5% per year, as compared to 8.8% for SPY over the same period.
|
YTD |
1-Year |
3-Year |
5-Year |
10-Year |
15-Year |
|
|
EFA Total Return (%) |
-7.92 |
-2.08 |
6.69 |
6.21 |
5.82 |
2.92 |
|
SPY Total Return (%) |
-8.28 |
11.51 |
17.5 |
14.83 |
14.12 |
10.07 |
Trailing total returns for SPY vs. EFA (Source: Morningstar)
Even if international equities have returned less than U.S. markets, there can still be an argument for international allocations because of diversification. Some allocation beyond the U.S. might increase a portfolio’s risk-adjusted return, as measured by the Sharpe ratio. Remarkably, the performance of developed market international equities outside of the U.S. has been sufficiently poor as to offset the diversification benefit in recent decades. Using Portfolio Visualizer to generate efficient frontiers for the past 10- and 20-year periods, there is no allocation to an international developed equity index that increases the Sharpe ratio of the S&P 500 alone.
On the basis of some fundamental models, EAFE stocks are expected to provide substantially higher returns than domestic stocks going forward. Research Affiliates’ Asset Allocation Interactive tool forecasts that EAFE will return 6.9% per year in annualized return, with volatility of 17.2%, for the next ten years, as compared to 1.9% per year, with 15.3% volatility, for U.S. large cap equities. This output is generated using a valuation-based model. RA’s yield and growth model forecasts 7% annualized return, with 17.2% volatility, for EAFE vs. 5.2% return with 15.3% volatility for U.S. large cap stocks.
At present, a global market-cap weighted equity index has about 40% of its assets invested outside of the U.S. It would seem irrational to ignore the parts of the global equity markets beyond the U.S. As a counterpoint, John Bogle famously asserted, decades ago, that there was no need to invest outside of the U.S. market.
Over the years, I have been somewhat mystified by the length and magnitude of the outperformance of U.S. equities. At some point, I believe, the difference in valuations between EAFE stocks and U.S. stocks will be great enough that EAFE stocks will perform at least well enough to justify their inclusion in a diversified portfolio (e.g. by increasing the Sharpe ratio).
Market-Implied Outlooks for EFA and SPY
One tool for considering allocations to international vs. domestic stocks is to look at the market-implied outlooks for EFA and SPY. The market-implied outlook is a probabilistic forecast of price returns that is derived from options prices and reflects the consensus view among buyers and sellers of options. There is active options trading on SPY and EFA, making it plausible to calculate market-implied outlooks for both.
Many readers will not have encountered market-implied outlooks before, so a brief explanation is warranted. The price of an option on an ETF reflects the market’s consensus estimate of the probability that the ETF’s price will rise above (call option) or fall below (put option) a specific level (the options strike price) between now and when the option expires. By analyzing the prices of options at a range of strike prices, all with the same expiration date, it is possible to calculate a probabilistic price return forecast that reconciles the options prices. This is the market-implied outlook. I regularly calculate and track the market-implied outlooks for major asset classes, including SPY and EFA. For readers who want a deeper explanation than I provide in the previous link, I recommend this excellent (free) monograph from the CFA Institute.
I have calculated the market-implied outlooks for EFA and SPY for the 10.1-month period from now until January 20, 2023 using options that expire on this date. I selected this specific expiration date to provide a view through the end of 2022 and because the options that expire in January tend to be among the most active.
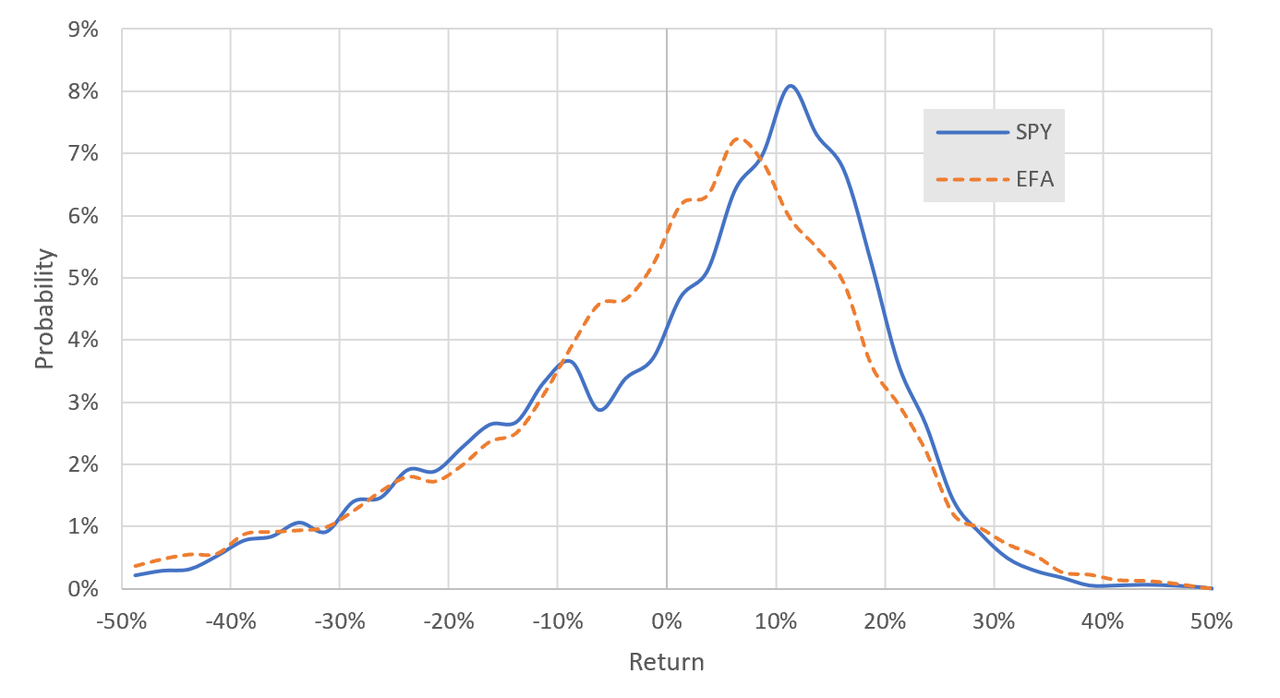
The standard presentation of the market-implied outlook is a probability distribution of price return, with probability on the vertical axis and return on the horizontal. Comparing the market-implied outlooks for SPY and EFA for the next 10.1 months shows a number of interesting features. The highest-probability outcome for SPY corresponds to a price return of 11.3% for this period. The highest-probability outcome for EFA corresponds to a price return of 6.7%. The expected (annualized) volatilities calculated from these distributions for SPY and EFA are 23.8% and 23.4%, respectively.
In an article from one year ago, I performed these same calculations using options that expired on January 21, 2022. The peak-probability price returns for SPY and EFA were 9.4% and 5.6%, respectively.

Market-implied price return probabilities for SPY and EFA for the 10.1-month period from now until January 20, 2023 (Author’s calculations using options quotes from E-Trade)
One of the metrics that I look at is the ratio of the maximum-probability return (aka the mode) to the expected volatility (not annualized). For SPY and EFA, this ratio is 51% and 31%, respectively. SPY looks more attractive than EFA on this basis. In considering the differences in most-probable outcomes, we have not yet added dividends. EFA has a forward dividend yield of 3.6%, as compared to 1.3% for SPY. Adjusting for the dividend for the 10.1-month period and adding the dividend to the price return, the ratio of mode return to volatility is 56% for SPY and 45% for EFA.
It is very interesting to see how closely the tails of the market-implied outlooks for EFA and SPY match up. This suggests that the probabilities of extreme events are somewhat comparable.
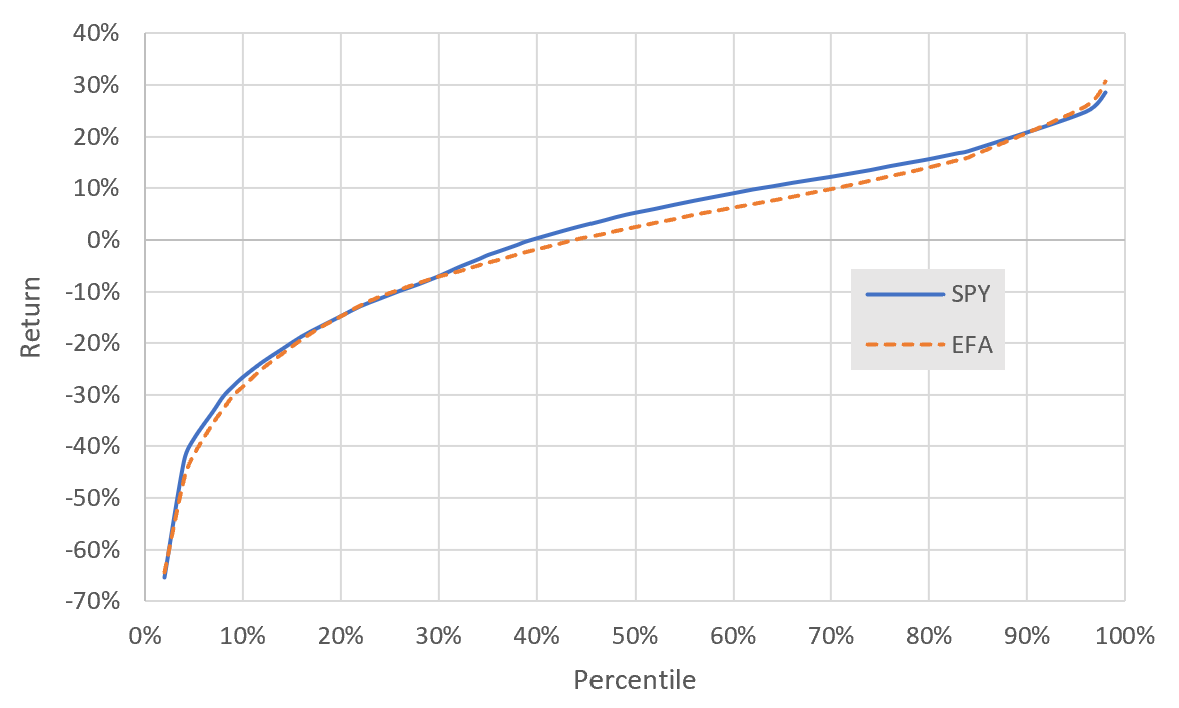
Another way to look at the market-implied outlooks is by looking at cumulative probabilities or percentiles of the distributions (see chart below). The 90th percentile return is the value at which 90% of outcomes are expected to be at or below this level, and 10% are expected to be above this level. The estimated 90th percentile returns for SPY and EFA are 20.1% and 19.7%, respectively. The 10th percentile returns for SPY and EFA are -26.5% and -28.4%, respectively. The 50th percentile price returns for SPY and EFA are 5.3% and 2.5%, respectively.

Cumulative market-implied price return probabilities for SPY and EFA for the 10.1-month period from now until January 20, 2023 (Author’s calculations using options quotes from E-Trade)
The market-implied outlooks suggest that SPY is likely to have higher price return and total return than EFA for the 10.1-month period from now until January 20, 2023. Even so, EFA looks quite attractive. With a peak-probability price return of 6.7% and about 3% in dividends over this period, the most-probable outcome is a total return of about 9.7%. For context, EFA has had a total return greater than 9.7% in 5 of the last 10 years.
Summary
EFA, which tracks the EAFE index, has returned considerably less than the S&P 500 (SPY) for more than 2 decades. On the basis of traditional valuation measures, EFA looks considerably cheaper than SPY and the expected return from EFA looks higher than for SPY using some fundamental models (such as Research Affiliates’ tool). On the other hand, the EAFE index is very light on technology (8.7% allocation) as compared to the S&P 500 (25.2% allocation) and EAFE is heavier on industrials (15.5%) as compared to the S&P 500 (8.3%). In other words, there are some major differences in the underlying factors that drive growth. The market-implied outlook for EFA suggests an attractive risk-return tradeoff, although less so than for SPY. Some allocation to EFA is reasonable for diversification purposes, although there is a fairly high probability that a U.S.-only portfolio will outperform over the next year. My analysis is purely statistical, of course, and investors with domain-specific expertise may have reasons to have a very different view. The market-implied outlook simply reflects the consensus among buyers and sellers of options. I am assigning a bullish rating for EFA, even though the options market suggests that SPY is likely to generate higher returns.
[ad_2]
Source links Google News

