[ad_1]

Lemon_tm/iStock via Getty Images
As growth stocks are bearing the brunt of the fierce bear attack, I believe it is an apt time to discuss value-focused exchange-traded funds, especially those using unconventional strategies that are designed to eliminate the flaws of so-called value-tilting minimalist portfolios focused on traditional P/E and P/B.
The Distillate Fundamental Stability & Value ETF (NYSEARCA:DSTL) is an investment vehicle we will be dissecting today. Established in October 2018, it tracks the proprietary Distillate U.S. Fundamental Stability & Value Index, a benchmark that is supposed to encompass cash-rich, high-quality U.S. bellwethers capable of delivering robust returns. Since its inception, the fund has amassed AUM slightly north of $561 million, with the asset flows being amongst the strongest in the class.
With an expense ratio of 39 bps, DSTL has a reasonable cost structure, which might appeal to long-term value investors seeking methodologies mindful of FCF and balance sheet robustness. For better context, its cash-focused peer COWZ, which I have discussed earlier this January, has an ER of 49 bps, while the asset class median stands at 29 bps.
Investment strategy
The index has a highly sophisticated methodology. Upon quarterly reconstitution every January, April, July, and October, its components face a complicated quality test, with size, liquidity, and valuation amongst considerations.
According to the supplement to the summary prospectus, five hundred U.S.-quoted companies boasting the highest float-adjusted market values can compete for a place in the 100 cohort in case they have no less than 5-year historical cash flow per share data, were even thinly profitable at least once in the previous three fiscal years, meet certain liquidity requirements, and have a 12-month FCF forecast from FactSet Research Systems Inc. Companies with headquarters in the U.S. or Ireland are eligible. Those that successfully met the criteria proceed to step two where their financial indebtedness, fundamental stability, and valuation are being examined. More specifically, the Debt/Income ratio, the historical and forecast volatility of cash flows, as well as the FCF yield (normalized FCF/Enterprise Value) are taken into account. Distillate Capital uses its own proprietary definitions for all the metrics.
One hundred companies that successfully passed all these tough tests are selected for the index, with weights distributed using a modified equal weight principle described in greater depth in the prospectus.
How does FCF to equity (the GAAP net CFFO after capital expenditures) of the DSTL holdings compare to their enterprise values? To assess that, I downloaded Profitability and Valuation data from the screener. I calculated FCFE by multiplying a company’s sales by its Capex/Sales ratio to arrive at capital expenditures, which were subsequently subtracted from the net operating cash flow; five financial sector stocks were excluded since FCF does not make sense for them.
I noticed two outliers, namely HCA Healthcare (NYSE:HCA) and Paccar (NASDAQ:PCAR); the former has negative FCF and, hence, a deeply negative yield, while the latter encountered FCF and net CFFO compression which resulted in EV/FCFE surging past 142x. PCAR, by the way, has one of the highest Capex/Sales in the group, ~7.5%. Excluding these outliers, the median EV/FCFE ratio is ~21.3x.
Returns that DSTL has delivered since inception illustrate the capabilities of this cash flow-focused strategy. For example, its compound annual growth rate (from 31 October 2018 to 31 December 2021) is ~1.4% higher than IVV’s. COWZ, which offers a relatively similar strategy though with larger exposure to the lower echelons of the U.S. market, also failed to keep pace with it, let alone the pure-value players from the S&P 500 (NYSEARCA:RPV).

DSTL,IVV,RPV,COWZ CAGRs comparison
Portfolio Visualizer
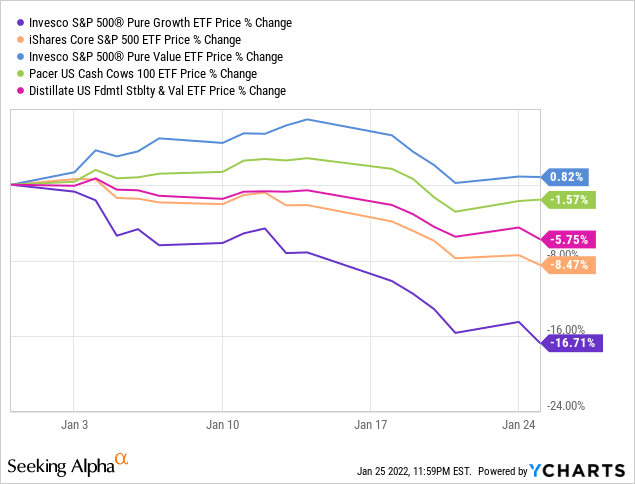
Among other things, its A+ Momentum grade illustrates that DSTL has been much more resilient to the early 2022 bear attack. Though it has not been totally immune to the broad-market decline this year, it still has been doing better than IVV, let alone pure-growth players (NYSEARCA:RPG). Interestingly, COWZ appeared to be more resilient.

Deeper delve into the portfolio
As of January 25, DSTL oversaw a portfolio of 100 stocks. Over 87% of its holdings (83 names) are the S&P 500 constituents; amongst those absent from the bellwether benchmark are VMware (NYSE:VMW), Westlake Chemical (NYSE:WLK), and Owens Corning (NYSE:OC), to name a few.
Alphabet (NASDAQ:GOOGL) is the only $1 trillion club member that DSTL has exposure to. This cash flow behemoth (around $89.4 billion LTM net CFFO and over $17 billion LTM FCF, as of my calculations) is only in 5th place at the moment, with ~1.9% weight.
It is worth noting that DSTL has measly exposure to the mid-cap echelon, with just 5% of the net assets allocated to 7 companies, while its peer COWZ has around a quarter of funds deployed to mid-/small-cap equities.
I would not say that the fund has a top-heaviness problem given just 19.6% allocation to ten main holdings, with Johnson & Johnson (NYSE:JNJ), a healthcare company boasting ~$22.5 billion LTM FCF and ~5.2% FCFE yield being a primary investment with just around 2.5% of the net assets. The weighted-average/median market capitalizations comparison does not raise concerns either, as the median stands at $33.5 billion with the WA at $133.9 billion.
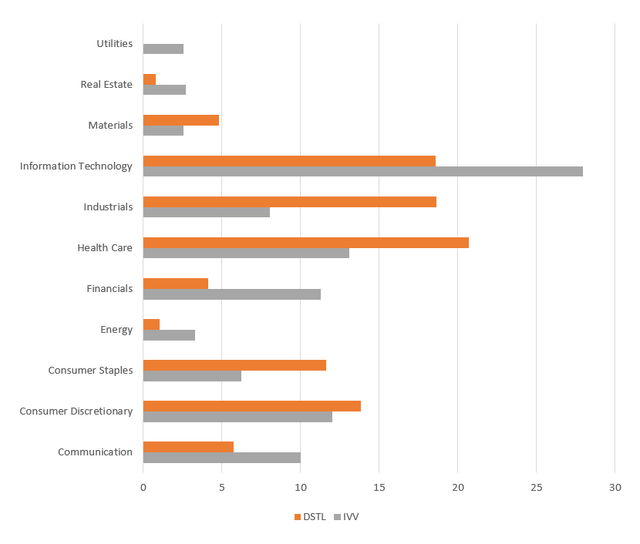
Unfortunately, there was no sector column in the Excel file I downloaded from the fund’s website, so I combined it with the one from the iShares Russell 3000 ETF (NYSEARCA:IWV). The differences in sector exposure between IVV and DSTL are illustrated below.

IVV, DSTL sector allocations
Created by the author using the data from IVV and DSTL
As you can notice, the Distillate ETF is remarkably overweight in industrials, healthcare, and consumer staples. At the same time, it has a much smaller footprint in the richly valued IT sector. I believe the key reason for DSTL being relatively underweight in IT is that most top tech players easily passed the FCF test, though appeared expensive on the FCF yield basis and were subsequently filtered out; the same applies to the case of the communication services. It has not invested in utilities, at all. Allocation to energy is in single digits more likely because of cash flow volatility and high debt load typical for that sector.
Quant factor exposure
The major vulnerability I should highlight is that DSTL is not as cheap as it might seem.
I see only ~23% allocation to stocks with Quant Valuation grades of B- or higher, while almost 50% of the net assets are parked in stocks that are valued terribly (D+ and worse). For better context, RPV had just ~6% invested in such stocks when I analyzed it two weeks ago. So rich valuation here is not necessarily a direct consequence of DSTL’s tilt towards large caps.
Two other factors I always address are growth and quality. DSTL’s footprint in growth stocks is only moderate as just ~19% of the holdings have at least B- grade. At the same time, quality is nothing short of impressive. Almost all stocks (over 98%) in its basket have excellent Profitability grades, while only BorgWarner (NYSE:BWA) and Sysco (NYSE:SYY) have a neutral score.
Final thoughts
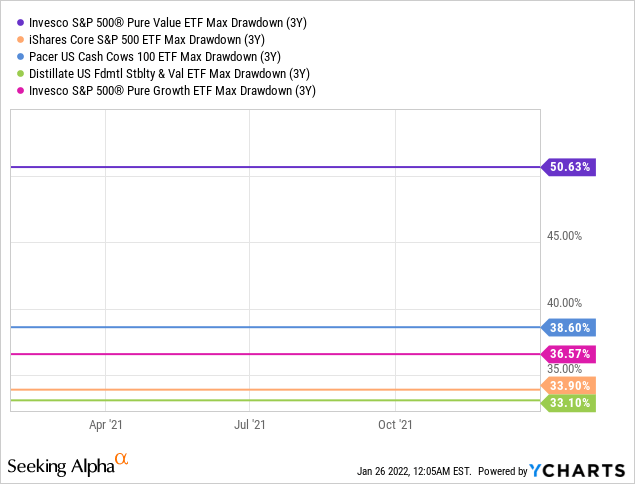
DSTL mixes quality and value ingredients to arrive at a portfolio of the most resilient, efficient, and comfortably priced U.S. stocks. As its (though relatively short) trading history illustrates, its investment strategy is capable of delivering alpha. In terms of risk, it also scores nicely. Its 3-year drawdown is lower compared to COWZ, RPV, RPG, and even IVV; the turnover (58% as reported in the prospectus) is adequate, especially considering numerous screens applied upon the index reconstitutions and sophisticated weighting.

But large exposure to stocks with poor Quant Valuation grades is a significant drawback. DSTL is a Hold.
[ad_2]
Source links Google News

