[ad_1]

400tmax/iStock Unreleased via Getty Images
Investment Thesis
As we progress more through 2022, I am becoming more and more confident that value stocks will be the safer place to be and earn investors the highest returns. The reason is that the market appears to be emphasizing company fundamentals and, specifically, profitability and valuation levels. ETFs bloated with many holdings for the sake of diversification are underperforming, while more focused funds with the right mix are doing well. This observation led me to research the Invesco Dow Jones Industrial Average Dividend ETF (DJD). Despite its lower diversification, I find most of its 27 constituents to be in good financial shape and trading at attractive prices. Its 3% dividend yield, low volatility level, and double-digit dividend and EPS growth estimates are all bonuses, and I am excited to walk you through this straightforward ETF and explain my buy rating in more detail.
ETF Overview
Strategy & Fund Basics
The Dow Jones Industrial Average is the oldest and most widely used barometer for U.S. blue-chip companies, except those included in the transportation industry or the Utilities sector according to Global Industry Classification Standards, or GICS. State Street has offered the SPDR Dow Jones Industrial Average ETF (DIA) since January 1998 with a current expense ratio of 0.16%.
DJD only launched in December 2015 but has a lower expense ratio of 0.07%. It holds only the dividend-paying companies in DIA, which is nearly all except for salesforce.com (CRM), Boeing (BA), and Walt Disney (DIS), which have a combined weight of 10.73% in the main Index. These exclusions are noteworthy, but I think investors will most appreciate how the remaining constituents are weighted. I’ll go over the fund in more detail later, but for now, here is a summary of DJD’s key statistics for quick reference:
- Current Price: $45.46
- Assets Under Management: $184 million
- Expense Ratio: 0.07%
- Launch Date: December 16, 2015
- Trailing Dividend Yield: 2.81%
- Three-Year Dividend CAGR: 26.88%
- Five-Year Dividend CAGR: 12.47%
- Dividend Payout Frequency: Quarterly
- Five-Year Beta: 0.90
- Number of Securities: 27
- Portfolio Turnover: 50.00%
- Assets in Top Ten: 59.00%
- 30-Day Median Bid-Ask Spread: 0.17%
- Tracked Index: Dow Jones Industrial Average Yield Weighted Index
- Index Reconstitution Frequency: Semi-Annually in March and September
- Weighting Scheme: Trailing 12-Month Dividend Yield
Sector Exposures & Top Holdings
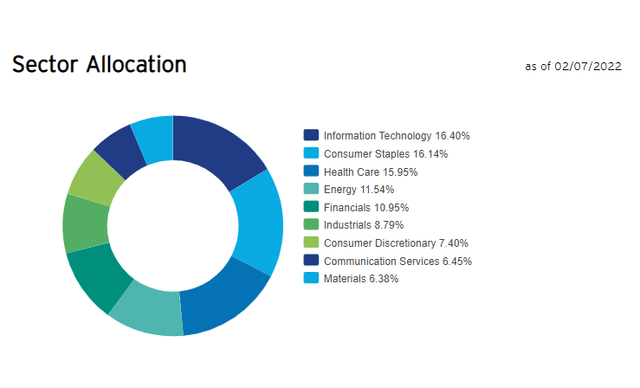
DJD is well-balanced across sectors, with five garnering more than a 10% allocation and Technology leading the way with 16.40%. This allocation is about 12% less than the S&P 500, so while this 27-stock fund won’t offer near the same level of diversification, I think limiting exposure to high P/E stocks often found in this sector is wise.
DJD Fund Overview
Regarding inflation protection, the 11.54% in Energy will help, but I would also suggest a targeted investment in large-cap Real Estate to make up for the zero exposure DJD has. I think you’ll find most Index funds lack exposure here, so this problem isn’t unique to DJD.
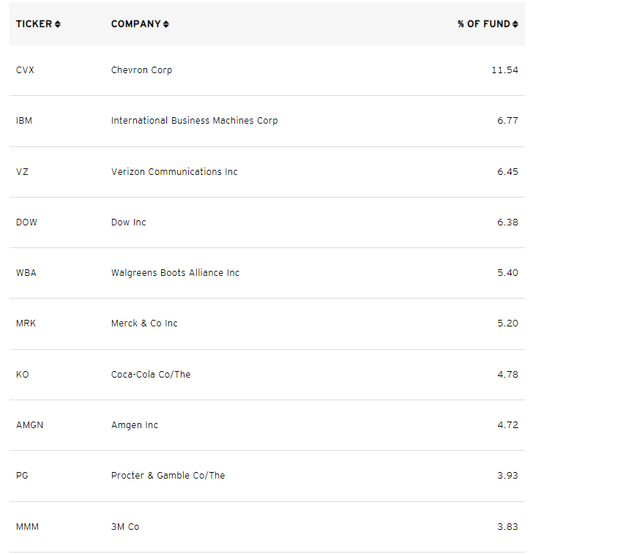
Due to its weighting scheme, DJD’s top ten holdings all have high dividend yields, though the order can significantly change between the Index reconstitutions. For example, while Chevron (CVX) is DJD’s largest holding, its dividend yield of 3.83% is only the fifth-largest. Others, including International Business Machines (IBM), Verizon Communications (VZ), and Dow (DOW), all have yields above 4.5%. The difference is that Chevron has easily outperformed nearly all other holdings recently except for American Express (AXP). Look for these allocations to be adjusted when the Index reconstitutes next effective after the third Friday in March.
DJD Fund Overview
Historical Performance
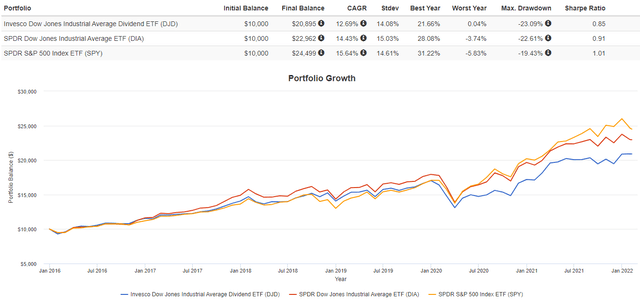
A yield-weighted ETF is similar to value-focused ETFs since price and yield move in opposite directions. And, it’s well-established that large-cap growth ETFs have outperformed large-cap value ETFs since DJD’s inception date, so it’s no surprise to see it trailing DIA and the SPDR S&P 500 Index ETF (SPY).
Portfolio Visualizer
As shown, the 12.69% annualized return trails DIA and SPY by 1.74% and 2.95%, respectively. The annual standard deviation was lower but not enough for the returns sacrificed. DJD’s risk-adjusted returns, as measured by the Sharpe Ratio, are weaker.
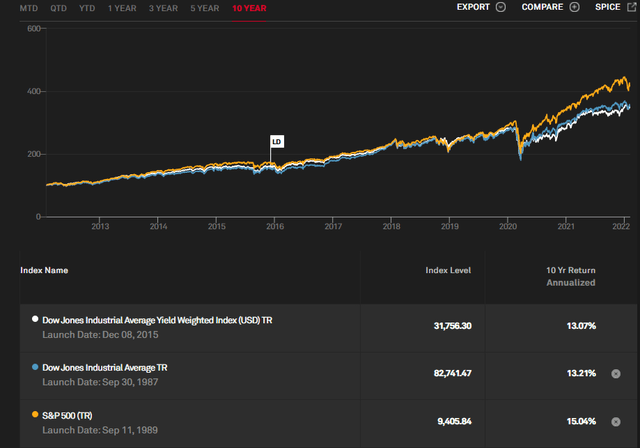
Though DJD launched in December 2015, it’s an easy strategy to backtest, so I find the numbers provided by S&P Dow Jones Indices reliable. The graph below shows almost identical ten-year annualized returns for both Dow Jones Industrial Average Indexes. With some quick math, I’ve calculated the annualized returns from February 2012 to February 2017 to be 13.43% for DJD compared to 12.31% for DIA.
S&P Dow Jones Indices
DJD Fundamentals
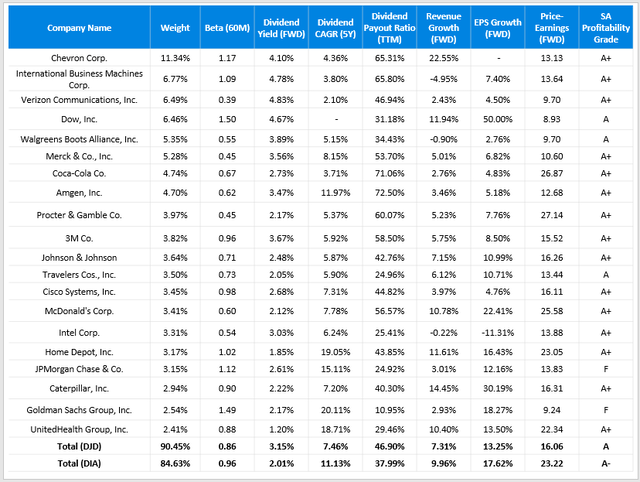
The table below summarizes various dividend, growth, and valuation metrics for DJD’s top 20 companies, totaling 90.45% of the ETF. I have provided the same metrics in summary form for DIA for comparison purposes in the last row.
Author Using Seeking Alpha Data
As shown, DJD has a weighted-average five-year beta of just 0.86. I think this will prove incredibly valuable in a correction since it suggests low volatility. I find it most interesting that estimated EPS growth is still high at 13.25%. Low-volatility ETFs often have low growth rates, too, suggesting they are only appropriate in the event of a correction. However, that’s not the case with DJD, and investors receive a steep discount of just 16.06x forward earnings compared to 23.22x for DIA.
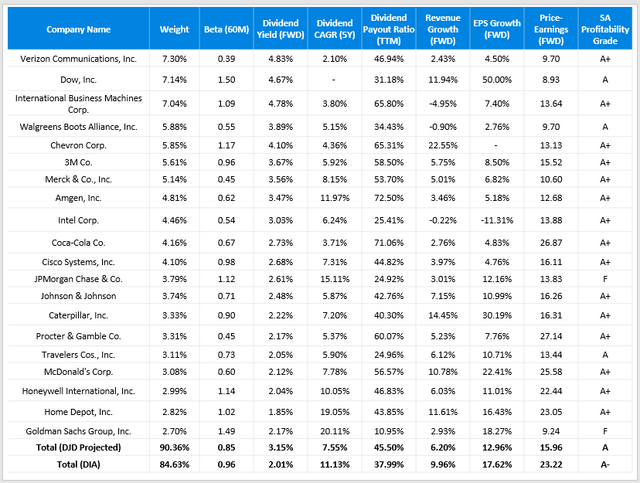
Profitability is also better, in part because Goldman Sachs is underweighted by 4.37%, and it received an “F” Grade from Seeking Alpha. Recall how Goldman missed on earnings by 9.37% last quarter, and the stock has fallen 7.39% in the previous month. It may be an overreaction, but sentiment tends to weigh on a stock until the next earnings season, and 86% of the Index has already reported earnings. By the time April rolls around, DJD will have already reconstituted, and on that note, here is how the fund would look if the Index changed today.
Author Using Seeking Alpha Data
You can see that despite Verizon Communications moving to the top of the list, most of the fundamentals remained the same. It’s projected to have a lower volatility level, lower revenue and earnings growth rates, and lower valuations, but the differences are negligible. Forward-yield is 3.15% or 1.14% more than DIA, payout ratios are below 50%, and constituents’ five-year dividend growth rate is decent at 7.55%.
Dividend Analysis
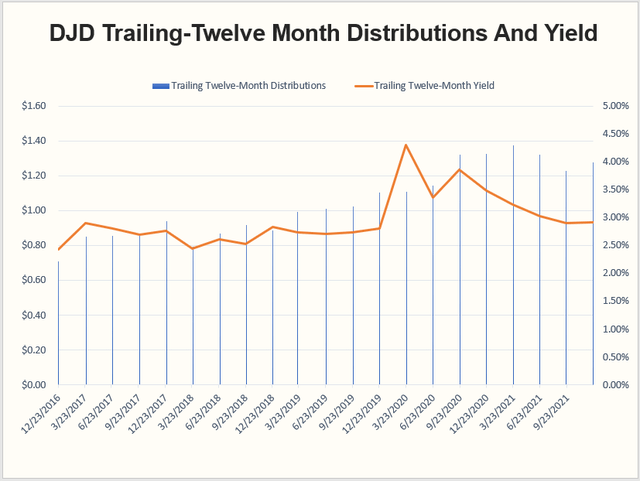
DJD’s distributions are primarily ordinary income, but about 8% of the 2017 distributions were in the form of short- and long-term capital gains. You can view the entire distribution history here, and I have summarized the ETF’s trailing twelve-month distributions and yields in the graph below.
Author Using Data From Invesco and Yahoo Finance
Yield has been trending downward since Q1 2020, when the market bottomed out, but the one-year distribution rate has increased from 0.71 in December 2016 to the current 1.28. This increase equates to the annualized 12.47% figure noted earlier.
Recall in the earlier table how DJD’s constituents have only increased dividends at a 7.46% rate, and I think this is an excellent time to touch on how investors can boost their dividends with ETFs. Put simply, if DJD did not reconstitute at all, investors would grow dividends close to the 7.46% rate. However, since DJD favors the highest-yielding stocks with each semi-annual reconstitution, investors will always receive a distribution rate that’s higher than the individual components. If it reconstitutes more frequently, such as quarterly, the fund’s dividend growth rate would be even higher, but I’m happy it’s not any more than semi-annually. Since dividend stocks are also value stocks, patience is required, and I don’t want a fund to reduce allocations in the highest-potential stocks too quickly.
Investment Recommendation
DJD is a low volatile ETF that trades at just 16x forward earnings with a double-digit dividend growth rate at a solid 3% dividend yield. Moreover, it also has double-digit EPS growth projections, so it’s unlikely to miss out on any market rebounds. While DJD may be too undiversified to be the sole holding in your dividend portfolio, it can make a great addition to it, and I’m confident it will be one of the better dividend ETFs to own this year. Therefore, DJD is a buy today, and I look forward to providing an update after its next reconstitution in March.
[ad_2]
Source links Google News

