[ad_1]
Torsten Asmus/iStock via Getty Images
(This article was co-produced with Hoya Capital Real Estate)
Introduction
Hoya Capital Real Estate
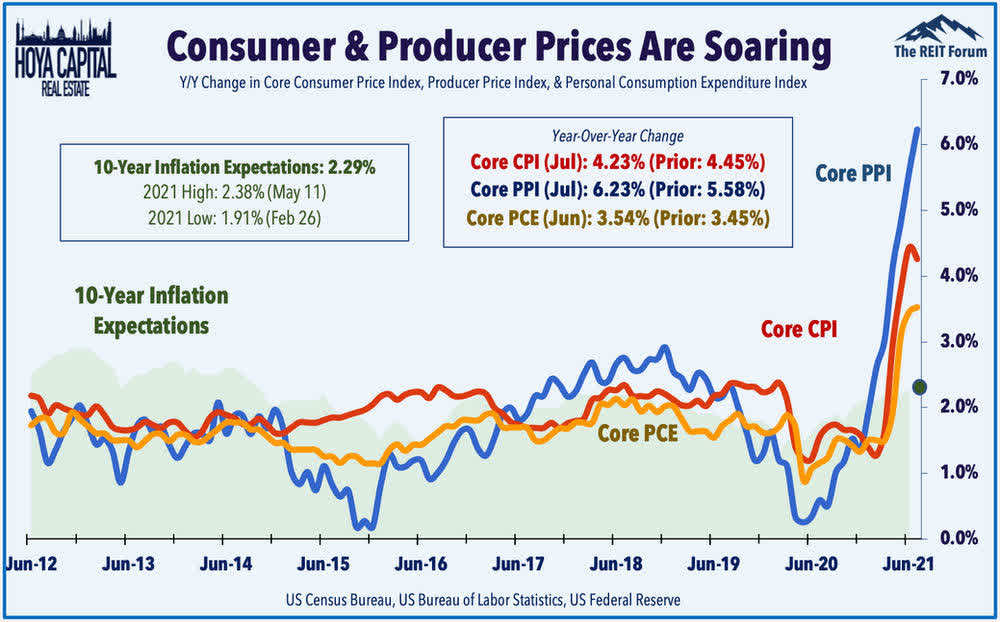
With inflation constantly hitting highs last seen in the early ’80s and the use of most Fixed Income assets to generate income while interest rates are rising is questionable, investors might turn to equity strategies that could help pay for their higher grocery, fuel, and rent costs.
This is the third in my series comparing pairs of Mid-Cap ETFs that use different indices. The first article compared SPDR S&P MidCap 400 ETF (MDY) and iShares Russell Mid-Cap ETF (IWR), which use popular indices. The second article compared Schwab U.S. Mid-Cap ETF (SCHM) with iShares Morningstar Mid-Cap ETF (IMCB) which use lesser known indices. With inflation becoming a “not going away soon” concern, this article will review and contrast two dividend focused ETFs: the WisdomTree U.S. MidCap Dividend Fund (DON) and the ProShares S&P Midcap 400 Dividend Aristocrats ETF (REGL). Despite their common goal of providing more dividend yield, each fund invests very differently, though their long-term returns are similar.
Why Mid-Caps for dividends?
When looking at any focused strategy, most investors do not want to give up too much in Total Return, especially if the goal is more income as one can always sell appreciated shares to increase their cash flow. Within the Mid-Cap space, I compared both ETFs against the Vanguard Mid-Cap ETF (VO), one of the best performers. This data goes back to 2015.

PortfolioVisualizer.com
REGL has done well, much better than DON on this measure. REGL also tops this set in all the risk measures. The next comparison requires acceptance of my considering dividend-focused funds as being more Value than Growth.

PortfolioVisualizer.com
While Mid-Cap Value placed second in CAGR, their risk ratios were close to Small-Cap Value stocks, the best performing asset size.
Exploring the WisdomTree U.S. MidCap Dividend Fund
Seeking Alpha describes this ETF as:
The fund is co-managed by Mellon Investments Corporation and WisdomTree Asset Management, Inc. It invests in public equity markets of the United States. It invests in stocks of companies operating across diversified sectors. The fund invests in growth and value stocks of mid-cap companies. The fund invests in dividend paying stocks of companies. The fund seeks to track the performance of the WisdomTree U.S. MidCap Dividend Index. DON started in 2006.
Source: seekingalpha.com DON
DON has $53b in assets with the managers charging 38bps in fees. The yield is only 2.17%.
WisdomTree U.S. MidCap Dividend Index review
This is how WisdomTree defines their Index:
The WisdomTree U.S. MidCap Dividend Index is a fundamentally weighted index that measures the performance of the mid-capitalization segment of the US dividend-paying market. The Index is comprised of the companies that compose the top 75% of the market capitalization of the WisdomTree U.S. Dividend Index after the 300 largest companies have been removed. The index is dividend weighted annually to reflect the proportionate share of the aggregate cash dividends each component company is projected to pay in the coming year, based on the most recently declared dividend per share.
Source: wisdomtree.com/index
The Index comprises 342 stocks, 54% have market-caps between $2-10b, with 46% over $10b in size. The MidCap Dividend Index is comprised of dividend-paying companies from the mid-capitalization segment of the WisdomTree U.S. Dividend Index. The Domestic Dividend Indexes are modified capitalization-weighted Indexes that employ a transparent weighting formula to magnify the effect that dividends play in the total return of the Indices. The following are applied to construct all the WisdomTree Dividend indices:
- A company must list its shares on a U.S. stock exchange.
- Be incorporated and headquartered in the United States.
- Pay regular cash dividends on shares of its common stock in the 12 months preceding the annual reconstitution, which takes place in December.
- Companies need to have a market capitalization of at least $100 million on the last trading day in November.
- Average daily dollar volume of at least $100,000 for three months preceding the end of November.
- Common stocks, REITs, tracking stocks, and holding companies are eligible for inclusion. ADRs, GDRs and EDRs are excluded, as are limited partnerships, limited liability companies, royalty trusts, Business Development Companies.
- Companies that fall within the bottom decile of a composite risk factor score, which is composed of on equally weighted score of the below two factors, are not eligible for inclusion.
- Quality Factor – determined by static observations and trends of return on equity (ROE), return on assets (ROA), gross profits over assets and cash flows over assets.
- Momentum Factor – determined by stocks’ risk adjusted total returns over historical periods (6 and 12 months).
- Companies that fall within the top 5% ranked by dividend yield and also the bottom ½ of the composite risk factor score are not eligible for inclusion.
- Index weighting is based on each component’s projected cash dividends to be paid over the coming year divided by the sum of the projected cash dividends to be paid by all the components in the Index.
DON ETF Holdings review
wisdomtree.com
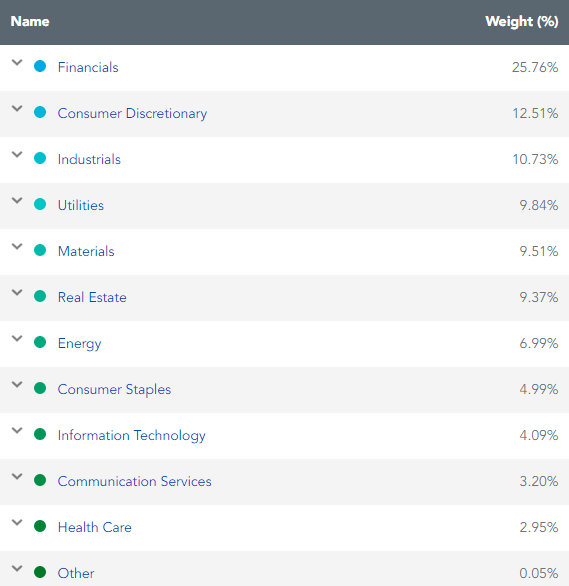
With its dividend mandate, Technology stocks are lightly represented. Also, with 25+% in Financials and another 9+% in both Utilities and REITs, this ETF is very exposed to the movement in interest rates with these sectors affected differently if rates continue to climb, as expectations are.
wisdomtree.com
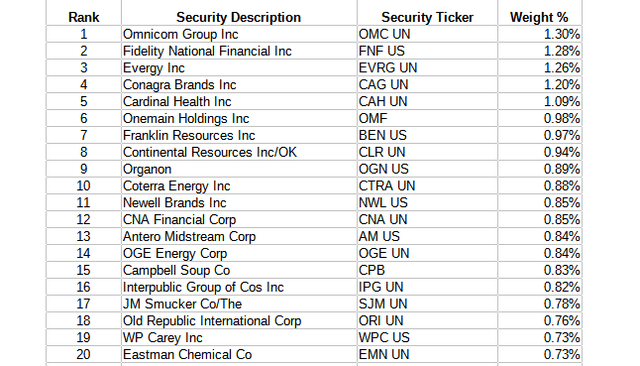
The Top 20, out of 343 stocks, represent almost 19% of the ETF’s asset value. While more than most I have reviewed, I would be more concerned about how the top sectors will perform from here as they equal almost 50% of the assets.
DON ETF Distribution review

seekingalpha.com DON DVDs
Dividends are paid monthly, and except for some year-end spikes, the payout has been below $.10 per month. According to the DON webpage, 100% of the payouts have come from Ordinary income. Seeking Alpha grades their payout history as a “B”.
seekingalpha.com DON DVD grades
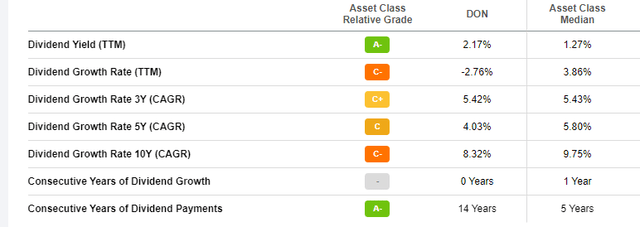
With a yield under 2.2%, how fast it is growing becomes more important. Notice that 2021 was slightly down from 2020, the year of COVID cuts. While the 10-year growth (8.32%) is great, it has slowed down considerably since.
Exploring the ProShares S&P Midcap 400 Dividend Aristocrats ETF
Seeking Alpha describes this ETF as:
ProShares S&P Midcap 400 Dividend Aristocrats ETF invests in stocks of companies operating across diversified sectors. The fund invests in growth and value stocks of mid-cap companies. It invests in dividend paying stocks of companies. The fund seeks to track the performance of the S&P MidCap 400 Dividend Aristocrats Index. REGL only started in 2015.
Source: seekingalpha.com REGL
REGL is much smaller than the DON ETF as only $1b in size. The managers charge 40bps in fees and the ETF currently yields 2.6%; more than DON but probably low for current income investors.
S&P MidCap 400® Dividend Aristocrats review
Unlike DON, REGL doesn’t control the index it uses. S&P describes their Index as:
The S&P MidCap 400® Dividend Aristocrats is designed to measure the performance of mid-sized companies within the S&P MidCap 400 that have consistently increasing dividends every year for at least 15 years.
Source: spglobal.com Index
While REGL started in 2015, the Index is older and the 10-year Total Return is 10%. REGL is the only ETF S&P lists as using this Index. Important facets of the Index include:
- Be a member of the S&P MidCap 400. Index must contain at least 40 stocks.
- Have increased total dividend per share amount every year for at least 15 consecutive years.
- At each annual reconstitution, such classification should not result in constituent stocks in a particular GICS sector accounting for more than 30% of the index’s weight.
- At each reconstitution and re-weighting, constituents are equal weighted. The Index is reconstituted each January, with the first quarterly rebalancing occurring simultaneously.
REGL ETF Holdings review
Proshares.com REGL
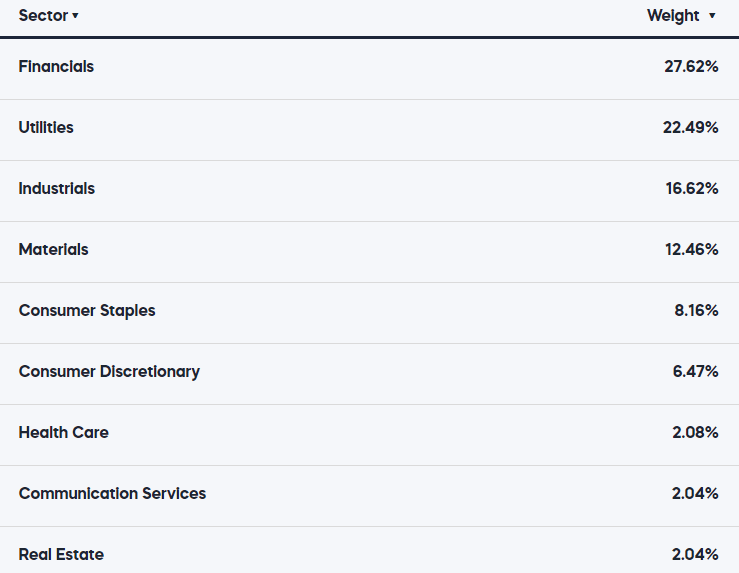
Like DON, REGL’s top sector is Financials, at a slightly higher weight. As important, the top 3 sectors are 67% of the portfolio so investors here better like those sectors going forward. Compared to the Index, REGL holds too little weight in the Industrial sector by 5%.
Proshares.com REGL
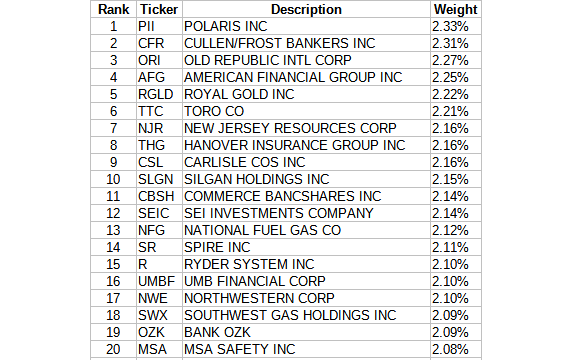
Not surprising, the Top 20 are 42% of the portfolio as REGL currently only holds 47 stocks. Their equal-weighting strategy is demonstrated by the weights shown. Except for one stock, which is down 17% in the last month, the smallest weight is 1.95%.
REGL ETF Distribution review

seekingalpha.com REGL DVDs
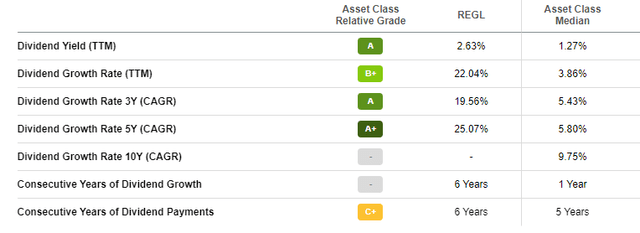
Unlike DON, REGL only pays dividends in the last month of each quarter. All payouts were from Ordinary income. Along with a better yield than DON, REGL’s dividend CAGRs are all near or above 20%, thus earning an “A+” from Seeking Alpha.
seekingalpha.com REGL DVD grades
Comparing ETFs
WisdomTree provides a comparison tool which I used for the following charts.
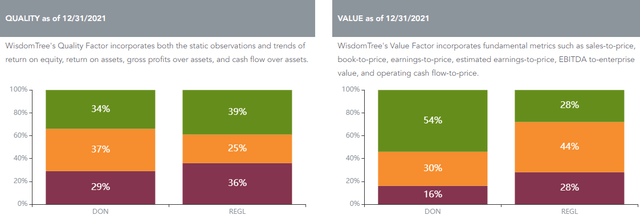
Green means Good; Orange Okay; and Maroon is bad after ranking each stock in the WisdomTree methodology.
WisdomTree.com Comparison tool
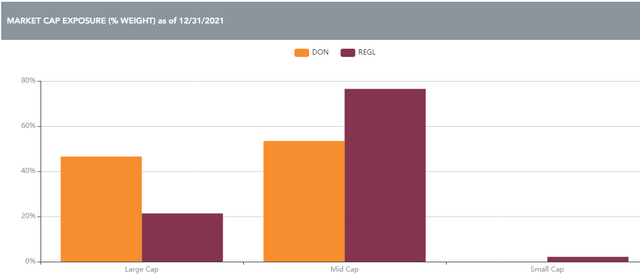
While Quality shows little difference, DON scores better on the WisdomTree Value scale. The next chart shows REGL is better at sticking to their Mid-Cap mandate.
WisdomTree.com Comparison tool
This can also be seen in the next set of numbers.

WisdomTree.com Comparison tool
With the larger percent in stocks with a market-cap over $10b, DON’s Average, Median, and Weight market-cap numbers are all bigger, with the WAMC 37% larger.
WisdomTree.com Comparison tool
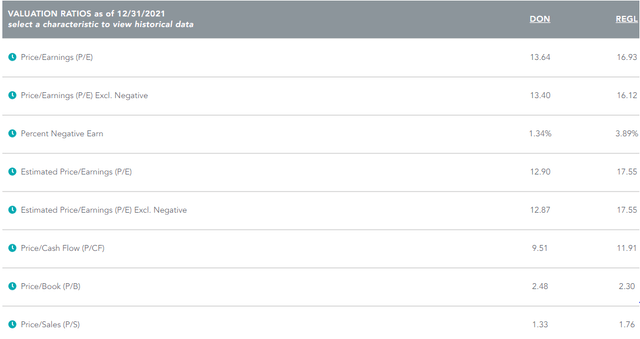
Price/Earnings ratios favor DON over REGL, as does EPS, P/BV, P/CF, and Sales growth data I found elsewhere. Another useful site for comparing ETFs is www.etfrc.com, which provides the next set of comparisons.
ETFRC.com
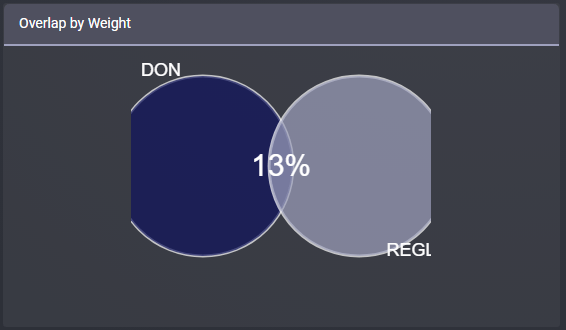
With only 13% of their weights overlapping, it’s an important sign they have different selection rules. With DON holding 343 stocks versus only 49 in REGL, almost 80% of the stocks owned by REGL are held by DON. REGL only holds 11% of the stocks held in DON.
ETFRC.com
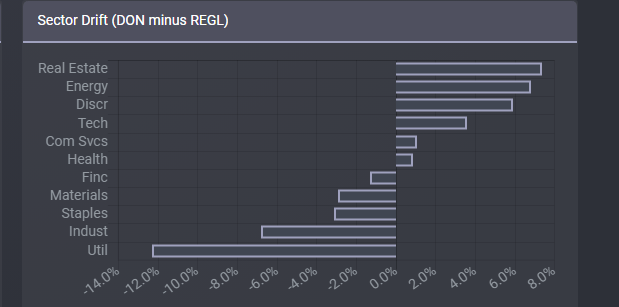
Compared to the pure Mid-Cap ETFs I reviewed in my other articles, the sector differences here are huge and thus important to an investor’s decision making. Lacking Utilities as DON does seem smart as their payout growth is low but that might partially explain its lower yield, though having a higher allocation to Real Estate might offset that as both sectors are two of the highest yielding ones. An oddity to me is Industrials and Energy under/over allocations as they tend to both move with the economy.
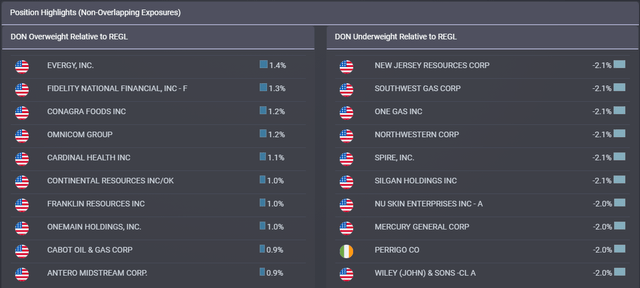
All of that translates into the ETFs having the following Top 10 weight differences for individual stocks.
ETFRC.com
Performance review
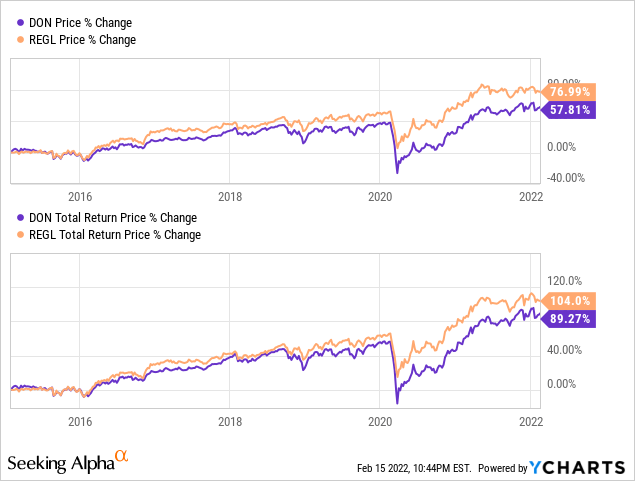
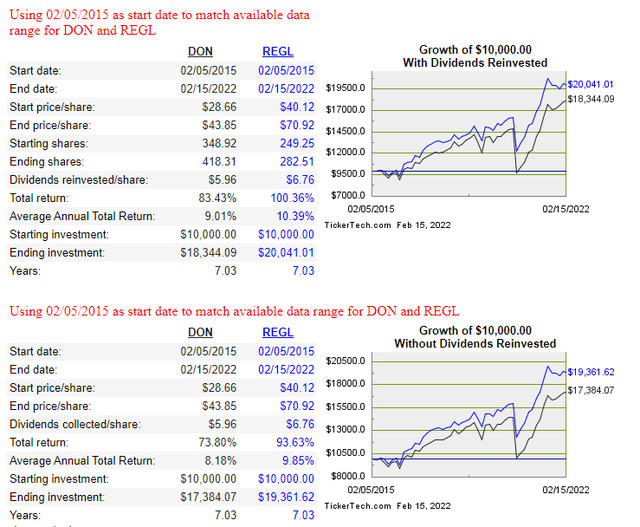
Since REGL started, it has been ahead of DON in generating return for investors. For those who might plan on selling shares to generate some income, REGL’s price advantage over DON is even greater than its Total Return.
Portfolio Strategy
There are some key differences between the DON ETF and the REGL ETF where investors’ preferences definitely come into play:
- Do you prefer the very concentrated strategy used by REGL or a wide coverage strategy like DON’s?
- With five sector allocations differing by 5% or more, what sectors do you prefer considering the current and future state of the US economy?
- Do you prefer the equal-weighting used by REGL or the dividend-weighting used by DON?
- Does the fact that DON invests a large percent in Large-Cap stocks a concern as you are already heavily invested in that market segment?
While REGL outperforms DON whether you reinvest or take the dividends, the gap between the returns favors REGL even more when not reinvesting, which could be the case if an investor bought the ETF for the cash flow.
dividendchannel.com/drip-returns-calculator
Final thought
For those who like the dividend strategy but prefer Large-Cap stocks, check this article out: DVY Vs. SCHD: Two ETFs Based On Different Dividend Rules Set By Dow Jones.
[ad_2]
Source links Google News

