[ad_1]

Scott Olson/Getty Images News
The iShares U.S. Dividend and Buyback ETF (BATS:DIVB) is a U.S. equity index ETF, investing in U.S. equities with large dividend payments and share buyback programs. DIVB’s underlying index is quite broad, and so the fund is quite similar to most broad-based U.S. equity indexes, including the S&P 500. Differences are few and far between. Although there is nothing inherently wrong or negative with the fund or its underlying index, it is simply too similar to most indexes to warrant an investment. As such, I would not be investing in the fund at the present time. Investors looking for dividend and buyback ETFs should consider an investment in the Cambria Shareholder Yield ETF (SYLD), which tracks a more appropriate index. I previously covered SYLD here.
DIVB – Basics
- Investment Manager: BlackRock
- Underlying Index: Morningstar US Dividend and Buyback Index
- Expense Ratio: 0.25%
- Dividend Yield: 1.77%
- Total Returns CAGR 3Y: 15.4%
DIVB – Overview
DIVB is an equity index ETF, investing in U.S. companies that return capital to shareholders dividends or buybacks. It tracks the Morningstar US Dividend and Buyback Index, an index of these same securities. Although I was not able to find detailed information concerning the fund’s index, their SEC Registration Statement explains said index in sufficient detail for our purposes.
DIVB’s underlying index is reasonable enough, but ensure that the fund’s underlying holdings / characteristics will closely match those of most broad-based U.S. equity indexes, including the S&P 500.
DIVB’s underlying index includes, and focuses, on U.S. companies with the largest dividend and buyback programs by dollar value. Most equity indexes, including the S&P 500, include, and focus, on U.S. companies with the largest market-capitalizations. Although these are technically different metrics, they are tightly linked. Large, profitable companies have large market-capitalizations and dividend and buyback programs: exceptions are few and far between.
As an example, we have Apple (AAPL). Apple is the country’s largest company, with a $2.8 trillion market-cap, and with the revenues and earnings of a multi-trillion dollar company. Apple also boasts the country’s largest shareholder capital distribution program, with the company spending $85 billion in share buybacks in 2021, and another $15 billion or so in dividends. Combined, the company returned about $100 billion in cash to shareholders, a massive, record-breaking amount. Most companies are simply too small for such massive distributions, but that is not the case for Apple.
Apple’s size makes it the largest component in the S&P 500, with a 7.0% allocation. Apple’s size allows the company to embark on a massive shareholder distribution program, which makes it the largest component in DVIB, with a 4.9% allocation. Very different indexes and rules, but same end result.
DIVB’s constituents account for 90% of total shareholder capital distributions in U.S. equity markets. These, almost by definition, include most U.S. equities by market-cap, for the same reasons as above. DIVB, unlike the S&P 500 and similar indexes, excludes companies with comparatively small shareholder capital distributions. These exclusions correspond to companies which account for 10% of total shareholder capital distributions in U.S. equity markets. These exclusions do differentiate DIVB from similar indexes, but the similarities (90%) are simply much larger than the differences (10%).
DIVB’s underlying index is structured in such a way that the fund should be extremely similar to most broad-based U.S. equity indexes, including the S&P 500. That is indeed the case, and for most relevant metrics. As an example, DIVB’s largest holdings are quite similar to those of the S&P 500. Both focus on mega-cap tech stocks, including Apple, Google (GOOGL) (GOOG), and Facebook (FB). Exceptions are few and far between, but include Tesla (TSLA) and NVIDIA (NVDA), which focus on growth over shareholder distributions.
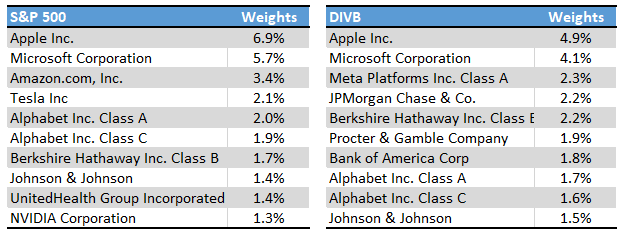
ETF.com – Chart by author
Expanding the analysis above to DIVB’s other holdings shows similar results. The vast majority of DIVB’s holdings are included in the S&P 500. The converse is also true, although less so.
There is quite a bit of overlap in fund weights as well.
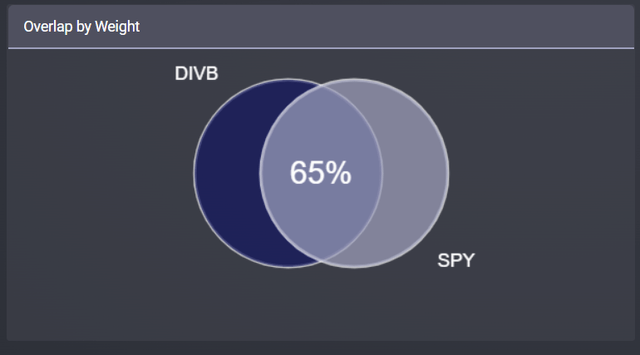
Etfrc.com
Finally, industry weights are also relatively similar, although DIVB is moderately underweight tech and consumer discretionary, while being overweight financials.
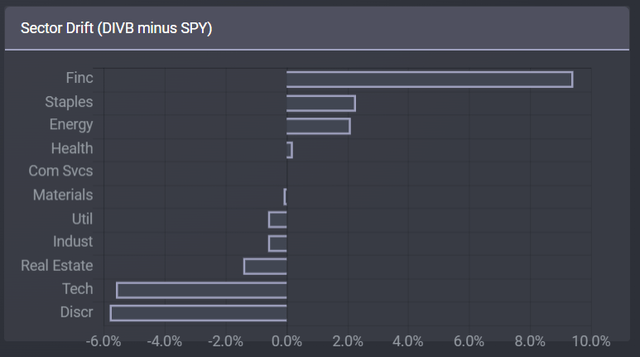
Etfrc.com
In my opinion, although DIVB does differ from S&P 500 somewhat, differences are simply too few, and too small to make a significant difference in the fund’s expected performance. DIVB is, functionally, quite similar to an S&P 500 index fund, and so investors should expect the fund to perform quite similar to one. Which brings me to my next points.
DIVB – Performance and Dividend Analysis
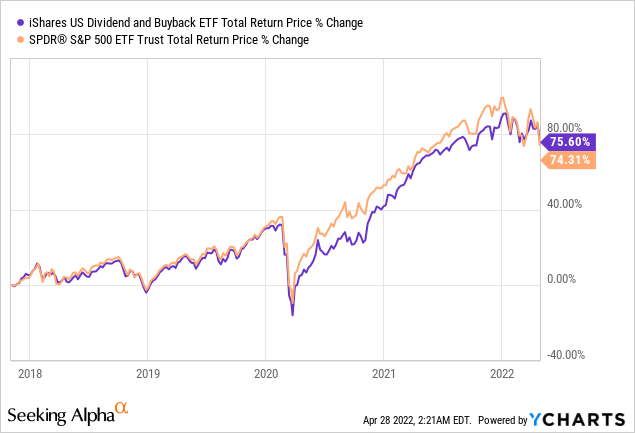
DIVB’s performance has closely tracked that of the S&P 500 since inception, as expected. The relationship is strong, and tight: DIVB’s performance rarely diverges from that of the index. The fund did slightly underperform from mid-2020 to early-2022, as the fund is overweight financials, and financials were hit particularly hard in the aftermath of the coronavirus pandemic.
DIVB’s dividend yield of 1.8% is also not materially different from the S&P 500’s 1.4% yield.
DIVB’s performance track-record and yield is quite similar to that of the S&P 500, as the fund shares most of the same characteristics and holdings of said index. As such, I expect DIVB to continue to perform in-line with the S&P 500 moving forward.
DIVB – Alternatives
As mentioned previously, although there is nothing wrong with DIVB being quite similar to the S&P 500 index, there is simply no worthwhile investment thesis here.
Investors looking for a broad-based U.S. equity index can easily invest in the myriad of S&P 500 index funds available in the market. These funds are cheaper than DIVB, and so have higher expected returns. These same funds are also slightly more diversified, and so are slightly safer. These are small differences, but differences nonetheless, and bearish for DIVB.
Investors looking for shareholder-yield ETFs should consider investing in SYLD. SYLD’s investment methodology is quite thorough, and more closely targets companies with above-average shareholder yields, with all the benefits and drawbacks that entails. SYLD’s performance is moderately different from that of the S&P 500, with the fund performing as something akin to a value fund (as shareholder yields are a value metric). SYLD’s performance track-record is slightly stronger than that of DIVB, with the fund slightly outperforming most relevant indexes since inception.
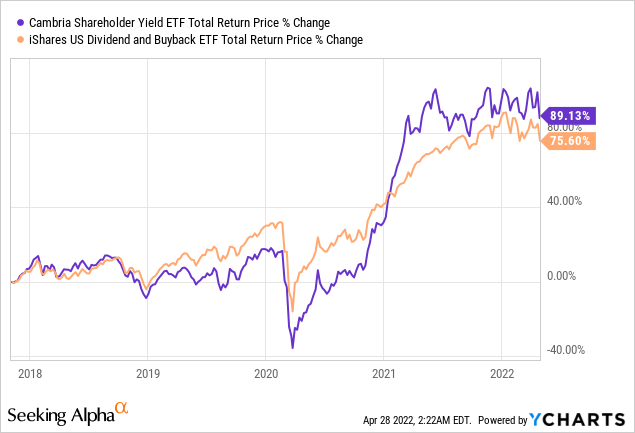
I last covered SYLD here.
Conclusion
DIVB is a U.S. equity index ETF, investing in companies with significant dividend and shareholder buyback programs. DIVB’s index, strategy, and holdings are all quite similar to those of the S&P 500, with few differences. As the fund offers relatively few benefits relative to larger, more diversified U.S. equity indexes, I see few reasons to invest in the fund.
[ad_2]
Source links Google News

