[ad_1]
Poring over ETFs in search of funds that appear to be deeply discounted relative to fair value is a task that continues to reveal a commodities-heavy list. Although valuing commodities is a gray area (primarily because there are no cash flows to analyze), using a proxy for value based on trailing five-year return points to this asset class in no uncertain terms.
Defining deep value via five-year return is based on a paper by AQR Capital Management’s Cliff Asness and two co-authors: “Value and Momentum Everywhere,” which was published in a 2013 issue of the Journal of Finance. Although there are many value metrics, the rationale for using five-year performance starts with the fact that it can be applied across a wide set of assets, thereby offering a level playing field for evaluating value. It doesn’t hurt that this measure is simple and therefore immune to estimation risk, which can complicate accounting-based value gauges. In short, five-year results offer a useful tool as a first approximation for identifying funds that appear to be deeply discounted by Mr. Market – a state that implies that expected returns are relatively high a la the value proposition for investing.
There’s no guarantee that value leads to superior performance – all the more so when applying value screens to commodities. Nonetheless, ranking a broad sweep of assets through a five-year-return lens provides perspective on global market trends.
With that in mind, let’s dive in and review value pricing across a broad range of markets. The ranking below covers 135 exchange-traded products that run the gamut: US and foreign stocks, bonds, real estate, commodities and currencies. (You can find the full list here, sorted in ascending order by annualized five-year return – based on 1,260 trading days – through April 18).
Note that the list is quite granular. In equities, for instance, the ETFs range from broad regional definitions (Asia, Latin America, etc.) to country funds, down to US sectors (energy, financials, for instance) and industries (e.g., oil & gas equipment & services). The only restriction is what’s available for US exchange-listed funds. Otherwise, the search is broad and deep, or at least as broad and deep as permitted given the current lineup of ETFs in the US.
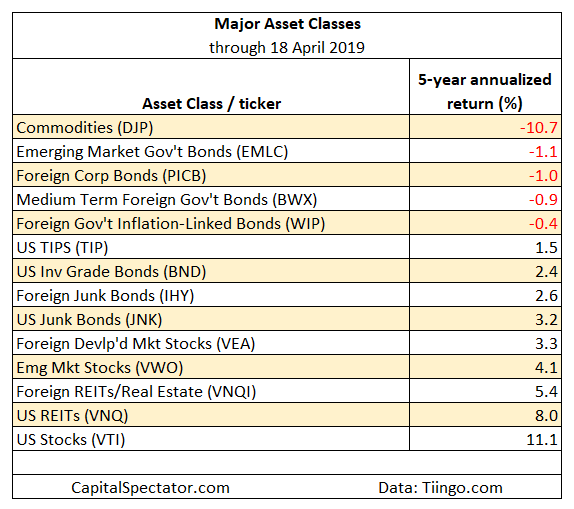
Let’s start with the major asset classes for a big-picture profile. Once again, a broad definition of commodities is the weakest performer by far. The iPath Bloomberg Commodity ETN (NYSEARCA:DJP) – an exchange-trade note by the way – is in the red by an annualized 10.7% on a trailing five-year basis – a performance that’s basically unchanged from our previous update in early March. The second-deepest five-year annualized loss is a relatively slight 1.1% decline in foreign bonds issued by governments in emerging markets via the VanEck Vectors J.P. Morgan EM Local Currency Bond ETF (NYSEARCA:EMLC). In fact, it’s worth noting that other than commodities, foreign bonds dominate the list for five-year losses for the major asset classes.

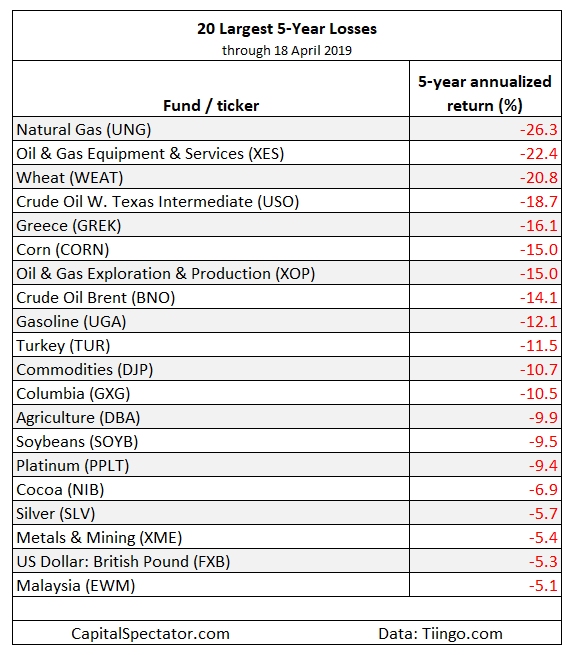
Let’s broaden the horizon with a look at the deepest 20 losses for the full list of 135 funds. The biggest setback (still) is in natural gas: The United States Natural Gas ETF (NYSEARCA:UNG) has lost an annualized 26.3% over the past five years. For equities, the deepest loss can be found in the SPDR S&P Oil & Gas Equipment & Services ETF (NYSEARCA:XES), which has shed an annualized 22.4%.

Finally, it’s useful to know how the opposite extreme is faring – the poster children for what some might call anti-value. The winner’s list for five-year annualized performance is currently held by the SPDR S&P Semiconductor ETF (NYSEARCA:XSD), which has earned an impressive 22.1% a year over the trailing 1,260 trading days.
Considering the two extremes, the spread between the best- and worst-performing funds is a hefty 48 percentage points. Mr. Market values his children with dramatically different expectations.
Editor’s Note: The summary bullets for this article were chosen by Seeking Alpha editors.
[ad_2]
Source link Google News

