")
[ad_1]

Ayman-Alakhras/iStock via Getty Images
Investment Thesis
The VictoryShares U.S. Small Cap High Dividend Volatility Weighted ETF (NASDAQ:CSB) has proven to be a superior product to Russell 2000 Value ETFs since its inception in July 2015, both in terms of higher returns and lower risk. Along with its comparatively higher yield, CSB investors have done well for themselves in the challenging small-cap value space.
However, I’m writing this article to urge investors to wait until the next earnings season concludes before initiating a position. The reason is that analysts are turning negative on many of CSB’s constituents, and they failed to impress much anyways with their most recent quarterly reports. Although the 16x forward earnings ratio is attractive, as is its estimated 2.85% dividend yield, it’s too risky right now, and therefore, I’m staying neutral. This article will explain why.
ETF Overview
CSB Strategy
CSB seeks to track the performance of the Nasdaq Victory U.S. Small Cap HighDividend 100 Volatility Weighted Index before fees and other expenses. The Index selects the 100 highest-yielding stocks from the Nasdaq Victory U.S. Small Cap 500 Volatility Weighted Index, which is a 500-stock portfolio screened for the following:
- four consecutive quarters of positive earnings
- largest stocks with under $3 billion in market capitalization
Weights for this parent indexed are determined based on the previous 180-day standard deviation of returns for constituents, with the least-volatile stocks receiving the highest weight. The $3 billion size limit is lower than what S&P Dow Jones considers small-cap ($3.6 billion), so I expect that to negatively affect quality but could potentially increase the fund’s potential in bull markets. I’ll be examining the fund’s holdings at the industry level later to confirm this.
CSB Sector Exposures and Top Holdings
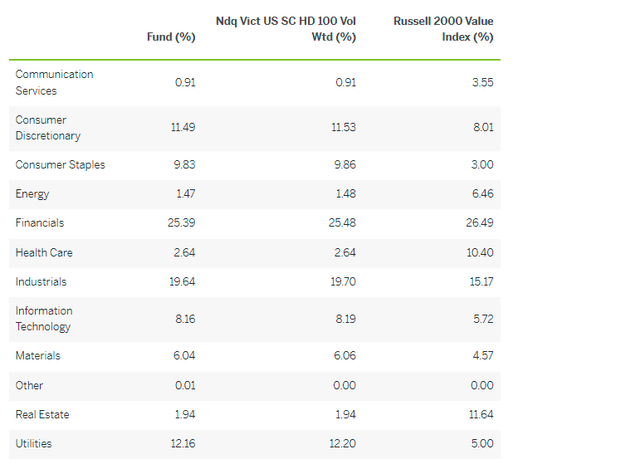
Relative to the Russell 2000 Value Index, the main differences include higher allocations to Consumer Staples, Utilities, and Industrials stocks, with offsets occurring in the Energy, Health Care, and Real Estate sectors. Due to underexposures in Energy and Real Estate, the composition doesn’t appear very inflation-friendly. I consider inflation a significant risk this year, so this could be a headwind for CSB.
CSB Fund Overview
Since it’s volatility-weighted, CSB will never have a high concentration of stocks in the top ten. Victory Shares touts this as a benefit, but my view is that it will only be beneficial if the largest stocks by market capitalization are either overvalued or of poor quality. Nevertheless, the top ten below account for 15.45% of the ETF and are shown below.
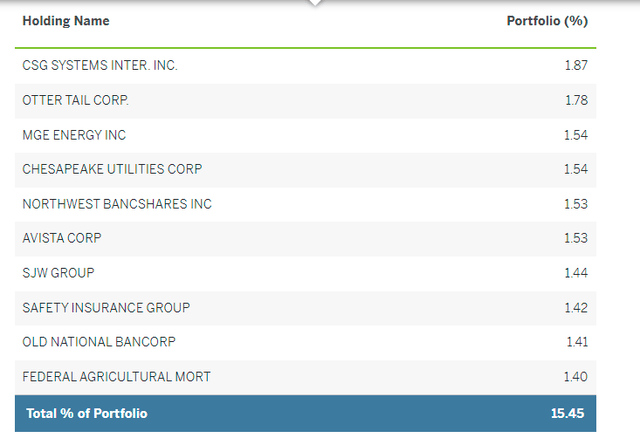
CSB Fund Overview
The top holding is CSG Systems (CSGS), a company in the Systems Software industry, followed by Otter Tail (OTTR) and MGE Energy (MGEE), two Electric Utilities stocks. Interestingly, even though Regional Banks is CSB’s largest industry with about a 20% weighting, Federal Agricultural Mortgage (AGM) is the only one in the top ten. Generally, this industry is quite volatile, so it’s a surprise to find 17 of these in a fund like CSB. To illustrate, the SPDR S&P Regional Banking ETF (KRE) and the iShares U.S. Regional Banks ETF (IAT) both have five-year betas of 1.25, while CSB’s Regional Bank stocks net out to a beta of just 0.88.
Before looking at performance, here is a summary of some descriptive statistics as of January 21, 2022:
- Current Price: $58.85
- Assets Under Management: $206 million
- Expense Ratio: 0.35%
- Launch Date: July 7, 2015
- Trailing Dividend Yield: 3.24%
- Three-Year Dividend CAGR: 11.40%
- Five-Year Dividend CAGR: 8.87%
- Five-Year Beta: 0.95
- Number of Securities: 101
- Assets in Top Ten: 15.45%
- 30-Day Median Bid-Ask Spread: 0.16%
- Premium To NAV: 0.01%
CSB Performance
In its relatively short history, CSB has performed well compared with the iShares Russell 2000 Value ETF (IWN), which seems like an appropriate benchmark given the fund’s selections. It’s gained 12.52% per year, assuming reinvested dividends, against just 9.21% for IWN. Volatility was also lower, making its risk-adjusted returns (Sharpe Ratio) appear even better.
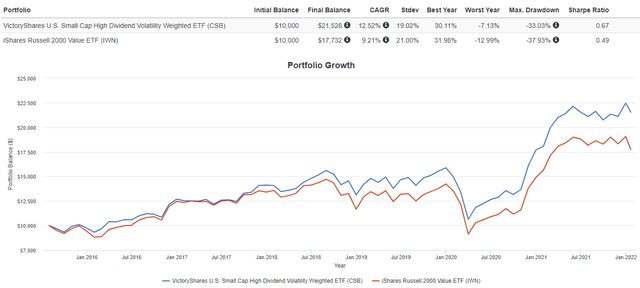
Portfolio Visualizer
These results serve as a decent foundation for CSB being an excellent alternative to small-cap value ETFs. However, as always, assessing its current holdings will help confirm that. Let’s take a look at some fundamental metrics next.
Fundamental Analysis
The following table highlights selected metrics for CSB’s top 20 industries, which total about two-thirds of the ETF. I’ve also included IWN’s net metrics so investors can get a clear picture of the trade-offs.
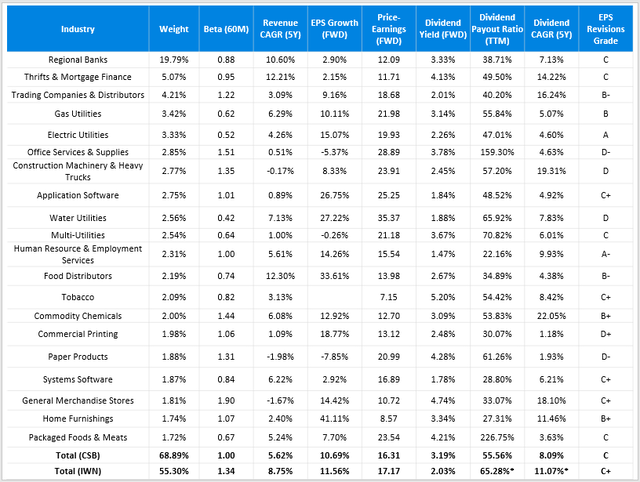
Created By Author Using Data From Seeking Alpha
I want to note how CSB’s weighted-average beta of 1.00 doesn’t make it look like a low-volatility ETF at all. However, it’s important to remember that it’s low-volatile for the small-cap space. Compared with IWN, which has several high-beta Energy stocks, CSB’s holdings truly are not very volatile. Still, I think if your primary objective is to cut down on portfolio risk, small-cap ETFs won’t be the most efficient way to do this.
Based on this snapshot, I find CSB’s fundamentals weaker than IWN’s. For example, the forecasted revenue and earnings growth rates of 5.62% and 10.69% are worse than IWN’s 8.75% and 11.56%. The table shows that Regional Banks, CSB’s largest industry by weight, only have a 2.90% forward EPS growth rate. By comparison, the median EPS growth rate is 6.00% for the 165 stocks in this industry in IWN. Investors are getting a slight discount based on the price-earnings ratio (16.31 vs. 17.17), but the difference is negligible.
Another key trade-off is CSB’s lower EPS Revisions Grade, which is a metric I emphasize, especially as earnings season approaches. The grade of C indicates analysts are lowering expectations at a faster rate compared with IWN. With 70% of the holdings set to report within the next 30 days, I find CSB to have a lot of earnings risk right now. Especially since they failed to impress much last quarter on the revenue side (2.13% surprise), there should be a better entry point soon.
On the positive side, CSB’s dividend yield is better than IWN’s. I have calculated the forward rate to be 3.19%, so after adjusting for the fund’s fees of 0.35%, investors should net around 2.85%. IWN’s yield for dividend-payers is 2.81%, but only 72% of its constituents pay a dividend, so that’s why its forward yield is only 2.03%. It may be enough to move the needle for some investors focused on yield, but I generally try to steer clear of high-dividend ETFs with a relatively high expense ratio. Plus, the dividend-paying stocks in IWN have grown their dividends faster over the last five years (11.07% vs. 8.09%), so CSB doesn’t appear to be the best choice for dividend growth investors.
Investment Recommendation and Conclusion
I would not recommend purchasing CSB right now because of its weak fundamentals and the fact that analysts are more bearish on its constituents relative to the Russell 2000 Value Index, the fund’s stated benchmark. Estimated revenue and earnings growth rates are low, especially with its Regional Bank selections, and these stocks also failed to impress much last quarter. I think investors should wait one month for a better entry point since, at that time, the majority of CSB’s constituents will have reported earnings. In my view, buying CSB ahead of earnings season is too risky.
CSB’s key benefits, as its name suggests, are that it’s a high dividend, low-volatility ETF. However, I want to remind readers that the estimated yield of 2.85% is easily achieved with other high dividend ETFs I report on each month. Also, these other dividend ETFs have lower betas than CSB, even though controlling volatility isn’t the stated objective. The reason is that the small-cap space is a very volatile one in general, so it’s probably not the best way to reduce risk. Simply put, I suggest waiting a month or so to see if its fundamentals improve and look for solid earnings surprises and analyst revisions before initiating a position.
[ad_2]
Source links Google News