[ad_1]
Enes Evren/iStock via Getty Images
Investment Thesis
The Pacer US Small Cap Cash Cows 100 ETF (BATS:CALF) just finished a tough quarter where it declined 15.70%, placing it in 51st place out of 67 small-cap dividend, value, and blend ETFs I track. This poor performance followed what was once an outstanding track record and reflects what I warned about in March. CALF’s previous excellent performance was likely due to the favorable sector mix that overweighted Consumer Discretionary stocks rather than the free cash flow factor itself. CALF was always a high beta portfolio; now that the market is down, this ETF is down even more.
The critical question is if it can recover. I think it can, but it will take some time. As I mentioned in March, I felt CALF’s screening process was important for small-cap stocks that are often too unprofitable to be investable over the long term. However, it will take a couple of quarters for its sector exposures to become more balanced. I also fear that its frequent reconstitutions will result in high-quality stocks being dropped precisely at the wrong time, so ultimately, I think it’s best investors sit this one out until the dust settles.
ETF Overview
Strategy, Sector Exposures, and Top Ten Holdings
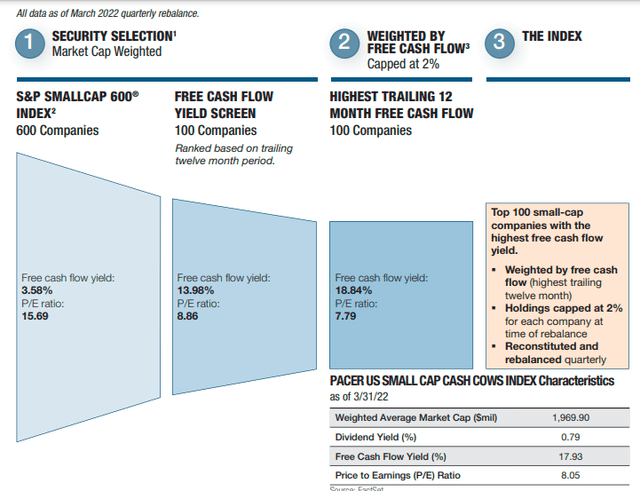
CALF tracks the Pacer US Small Cap Cash Cows Index, selecting 100 companies from the S&P SmallCap 600 Index with the highest free cash flow yields. All calculations are on a trailing twelve-month basis, individual constituents have weights capped at 2%, and free cash flow dollars weight the Index (not free cash flow yield). As a result, CALF still has a size tilt since larger companies are more likely to have higher free cash flow dollars. Still, the most significant flaw is the lack of capping at the sector level. CALF routinely overweights the Consumer Discretionary sector each time it reconstitutes quarterly, putting it at a severe disadvantage in down markets. The graphic below, provided by Pacer ETFs, summarizes the selection and weighting process.
Pacer ETFs
The statistics above are outdated, but the story is the same. CALF consistently holds low P/E stocks with high free cash flow yields. Investors pay a hefty fee (0.59% expense ratio) for this portfolio, and since it reconstitutes so frequently, you have to believe the strategy will work in the long run. It’s difficult for most retail investors to regularly evaluate the portfolio and trade CALF accordingly. Portfolio turnover routinely exceeds 100%.
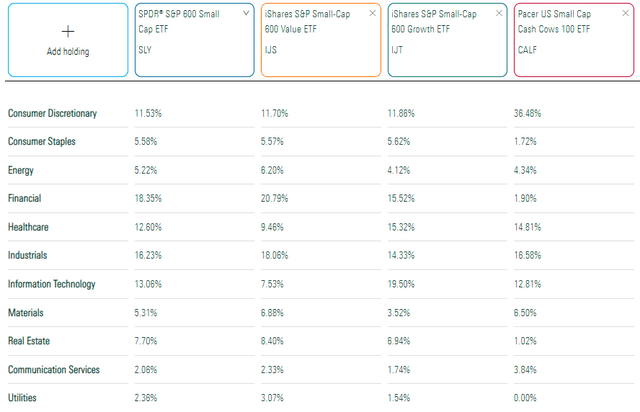
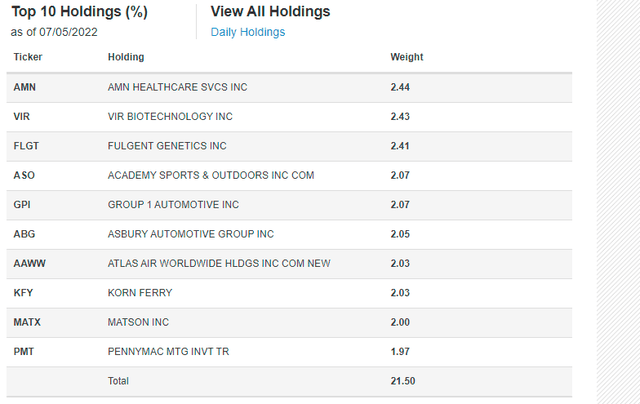
As mentioned, CALF overweights Consumer Discretionary stocks. Currently, exposure is 36.48% compared to 11-12% for various cuts of the S&P SmallCap 600 Index. CALF also has hardly any Financials exposure and has no exposure to Utilities stocks due to their capital-intensive nature. Free cash flow is a company’s operating cash flow minus capital expenditures (expenses, interest, taxes, and long-term investments), so this sector is at an immediate disadvantage.
Morningstar
Pacer ETFs
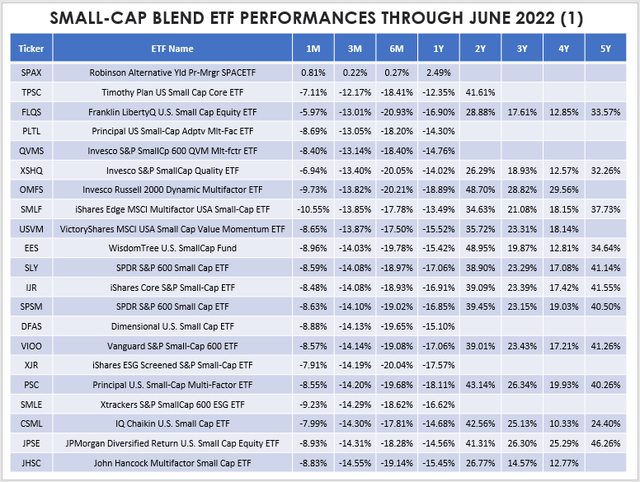
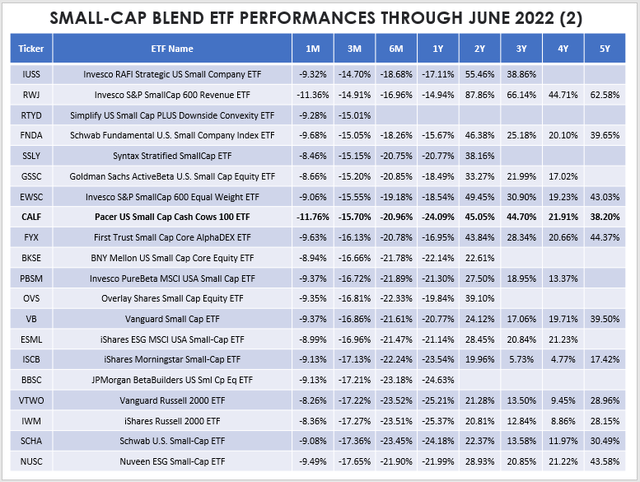
This graph looked very different at the end of the year. As of December 31, 2021, CALF outperformed IJR and IJS by 0.04% and 2.15% per year. Depending on how you classified it (blend or value), you could have made the case that CALF was a top-notch fund and was worth the high fees. Here’s how CALF’s historical performance compares with 40 others in the small-cap blend category (sorted by three-month returns). In Q2, its 15.70% loss was 29th best. In the last five years, CALF’s 38.20% total return was 13th best out of 22 with enough history.
The Sunday Investor
The Sunday Investor
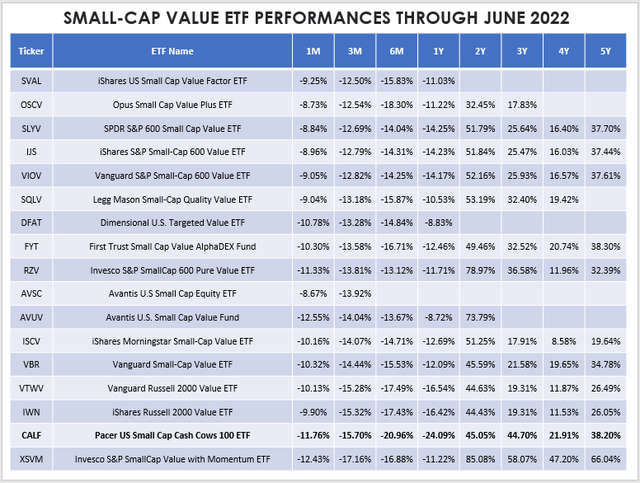
If we classified CALF as a small-cap value ETF, its Q2 15.70% loss was 16th best out of 17. Still, over the last five years, its 38.20% total return was third-best out of 11. The Invesco S&P SmallCap Value With Momentum ETF (XSVM) remains the best five-year performer, but even it wasn’t immune to the market downturn. Unsurprisingly, XSVM is also a high-beta ETF, so these funds really need to be used cautiously.
The Sunday Investor
Fundamental Analysis
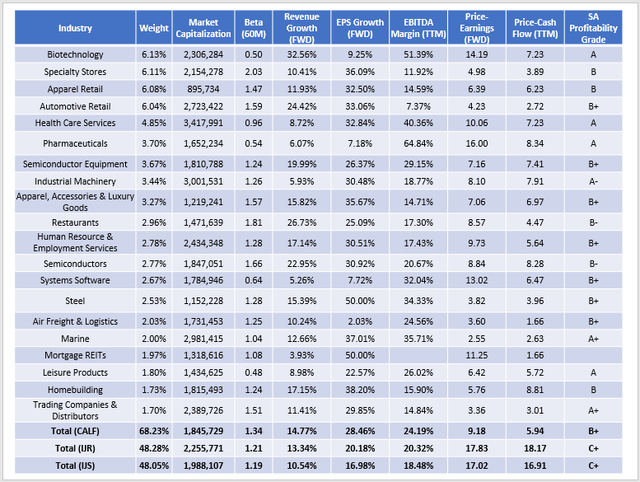
Here’s a look at various fundamental metrics for CALF’s top 20 industries. For comparison purposes, I’ve included summaries for IJR and IJS, and I think this shows CALF in a favorable light.
The Sunday Investor
First, we see that CALF’s weighted-average market capitalization of $1.85 billion is below that of IJR and IJS, but not by much. Higher weight is assigned to Apparel Retail stocks like Children’s Place (PLCE), Chico’s FAS (CHS), and Urban Outfitters (URBN). Academy Sports and Outdoors (ASO) and Signet Jewelers (SIG) are two of CALF’s four Specialty Stores holdings. Therefore, a substantial portion of the fund is exposed to retail stocks, which largely plunged last quarter. The University of Michigan’s Consumer Sentiment Index reading reached a record low in June, and historically, it’s been a reasonably reliable indicator of recessions. Almost like a self-fulfilling prophecy, consumers will likely cut back on discretionary spending if they aren’t optimistic about their financial future.
Second, I must acknowledge the 1.34 five-year beta, partially caused by these same retail stocks. Add in Automotive Retail stocks like Sonic Automotive (SAH) and Restaurant stocks like Bloomin’ Brands (BLMN), and CALF turns into an ETF dependent on strong consumer spending and, by extension, a strong economy. It’s not built for market downturns, even though a free cash flow screen may suggest otherwise. Merely surviving a recession does nothing to change the fact that these are simply risky companies. Unfortunately, there’s no screen to limit this risk.
However, there isn’t much negative to say when I look at CALF’s growth, valuation, and quality. Its constituents are projected to grow sales faster than IJR and IJS. CALF trades at just 9.18x forward earnings, which is nearly unheard of but, unsurprisingly, rivals the Pacer US Cash Cows 100 ETF (COWZ). Its trailing price-cash flow is also ultra-low, and EBITDA margins look good, as do CALF’s estimated earnings per share growth rates. I should note that EPS growth rates for small-cap funds can be misleading, especially when constituents are in recovery mode. If profits were negative the prior year, you can’t calculate an accurate growth rate this year. That’s the case for 31 of CALF’s 100 constituents (31.23% of the total weight), so the EPS figure quoted is likely too high. Still, I’m confident CALF’s selections are high-growth names with low valuations. Pacer ETFs appear to favor this approach.
Investment Recommendation
My concerns today remain the same as in March. CALF has too much exposure to volatile Consumer Discretionary stocks and requires strong consumer spending and an optimistic market to perform well. I don’t think that’s the case today, so I don’t recommend initiating a position. Despite the risk, the plus side is that most constituents appear to be good-quality small-cap stocks that will eventually bounce back. CALF had a tough second quarter, but those losses can reverse if and when markets recover. I just wish I had a better answer on the timing.
In short, CALF is used best as a tactical ETF. If you think markets have bottomed, it’s a great way to boost your returns without relying too much on unprofitable speculative stocks. Otherwise, I don’t think it’s worth buying. I hope you found this analysis helpful, and if you have any questions on CALF or any of the ETFs mentioned, please feel free to comment below.
[ad_2]
Source links Google News

