[ad_1]

PashaIgnatov/iStock via Getty Images
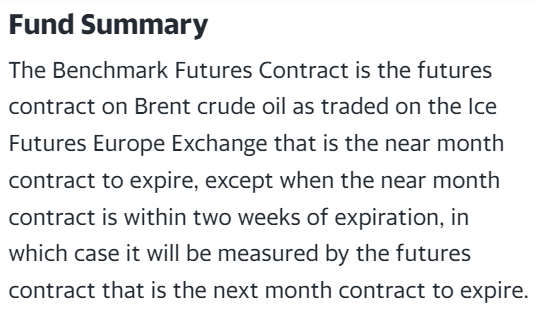
The United States Brent Oil Fund, LP (NYSEARCA:BNO) (“the Fund”) is an exchange-traded fund (“ETF”) organized as a limited partnership. BNO’s investment objective is to track a benchmark of the short-term Brent crude oil futures contract, as described below.
Yahoo Finance
The top holdings are listed below, although it appears to be out-of-date since it lists an April 2020 futures contract, though the holdings are listed as of April 30, 2022.

Seeking Alpha
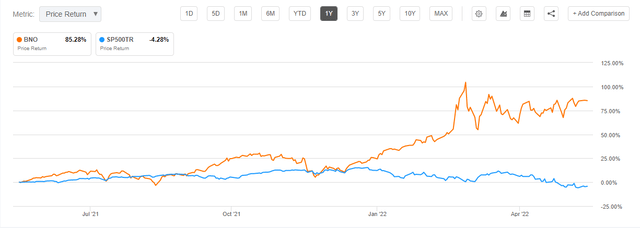
Over the past year, BNO has gained 85%, in contrast to the S&P 500 (SP500TR), which lost 4 % over the same time period. Much of the gain was posted following the commencement of Russia’s February 24th “Special Military Operation” in Ukraine, since it involves a major oil producer/exporting country, Russia. However, the conflict had been anticipated by the market, with 50% of the gain in BNO occurring prior to February 24th.
Seeking Alpha
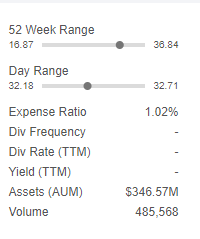
BNO’s Assets Under Management (“AUM”) is about $345 million, and the Fund charges an expense ratio of 1.02%.
Seeking Alpha
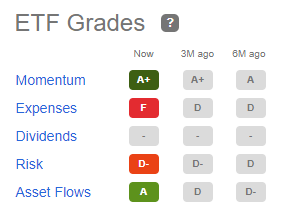
According to Seeking Alpha’s ETF Grades, that expense ratio rates an “F.”
Seeking Alpha
Brent Crude Oil
Brent is produced in the North Sea area of the Atlantic Ocean and is pipelined to the Sullom Voe terminal in the Shetland Islands of Scotland. It is a “waterborne crude oil” on which ICE’s Brent benchmark is based because it has access to global shipping, port and storage capacity. This gives it an advantage over other crudes which are landlocked and regional.
Refiners around the world process it. And it is a benchmark used to price over three-quarters of the world’s traded oil, as one of the most “liquid” crude grades. As such, it reflects global supply and demand factors, as well as expectations and risk premia.
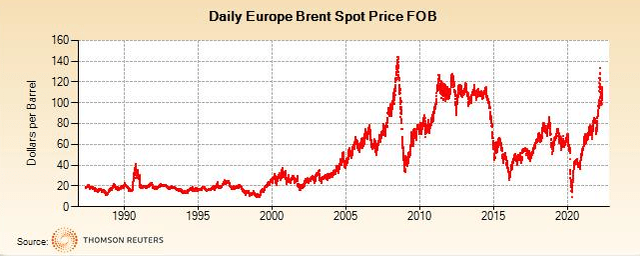
The graph below depicts the daily prices of Brent spot prices, which are highly correlated to Brent futures prices.
Thomson Reuters
However, in the BNO prospectus, the Fund notes that:
The correlation between changes in prices of the Benchmark Futures Contract and the spot price of Brent crude oil may at times be only approximate. The degree of imperfection of correlation depends upon circumstances such as variations in the speculative oil market, supply of and demand for Futures Contracts (including the Benchmark Futures Contract) and Other Crude Oil-Related Investments, and technical influences in oil futures trading.”
In addition, the Fund notes that:
Natural forces in the oil futures market known as ‘backwardation’ and ‘contango’ may increase BNO’s tracking error and/or negatively impact total return. The design of BNO’s Benchmark Futures Contract is such that every month it begins by using the near month contract to expire until the near month contract is within two weeks of expiration, when, over a four day period, it transitions to the next month contract to expire as its benchmark contract and keeps that contract as its benchmark until it becomes the near month contract and close to expiration. In the event of a Brent crude oil futures market where near month contracts trade at a higher price than next month to expire contracts, a situation described as ‘backwardation’ in the futures market, then absent the impact of the overall movement in Brent crude oil prices the value of the benchmark contract would tend to rise as it approaches expiration. Conversely, in the event of a Brent crude oil futures market where near month contracts trade at a lower price than next month contracts, a situation described as ‘contango’ in the futures market, then absent the impact of the overall movement in Brent crude oil prices the value of the benchmark contract would tend to decline as it approaches expiration. When compared to total return of other price indices, such as the spot price of Brent crude oil, the impact of backwardation and contango may cause the total return of BNO’s per share NAV to vary significantly. Moreover, absent the impact of rising or falling oil prices, a prolonged period of contango could have a significant negative impact on BNO’s per share NAV and total return and investors could lose part or all of their investment. See ‘Additional Information About BNO, its Investment Objective and Investments’ for a discussion of the potential effects of contango and backwardation.
BNO v. Brent
The graph below depicts the monthly averages of spot Brent prices and BNO share prices.

Boslego Risk Services
I performed a least squares linear regression analysis of the two price series from the inception of the BNO Fund (July 2010) through April 2022. The r-squared, or percentage in which the dependent variable (BNO) is explained by movements in the independent variable (Brent) is high (91 %), though not perfect.
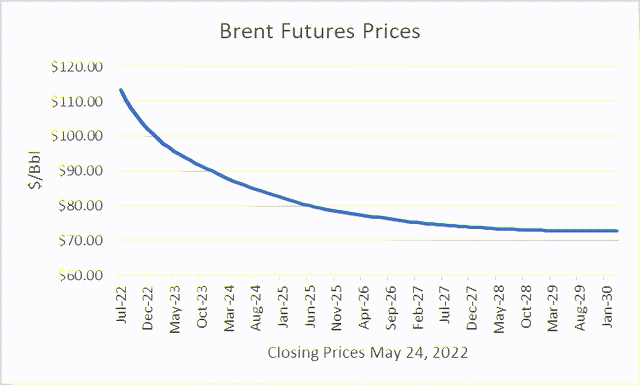
Using the regression model and the Brent “strip” of futures prices as of May 24th…
Barchart
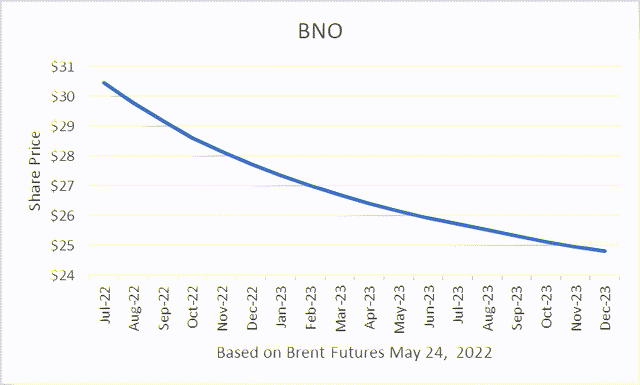
…I was able to generate a projection of future BNO values, assuming those futures prices held. Because Brent futures prices are “backwardated,” meaning the nearby contracts are priced higher than the deferred contracts, the projection shows BNO values dropping over time.
Boslego Risk Services
Of course, futures prices are volatile and may rise as they become the nearby month, due to the “war risk premium” that may get priced in.
The U.S. has banned imports of Russian oil, and many countries have isolated Russia through sanctions. In addition, there is a proposal in the EU to ban Russian imports to that market within a six-month timeframe. And Russia has recently cut-off Finland from its imports of Russian natural gas due to its application to join NATO.
Some observers reason that the EU will not get the unanimous vote to ban Russian oil because of dependence on their oil for their economies. If that is the case, at least some of the risk premium embedded in oil futures prices may evaporate.
In addition, the U.S. has been attempting to renegotiate the Iran “nuclear deal,” which could remove sanctions from Iranian oil exports. And the Biden Administration has announced that it “will ease some sanctions on Venezuela in exchange for continued dialogue between President Nicolás Maduro and the opposition.” Chevron’s (CVX) CEO Mike Wirth said CVX can help double Venezuela’s 800,000 barrels per day production within months.
Also, the U.S. had announced that it will draw down its Strategic Petroleum Reserves (SPR) by 180 million barrels over 6 months, amounting to one million barrels per day. And the International Energy Agency (IEA) announced an additional 60 million barrel SPR drawdown.
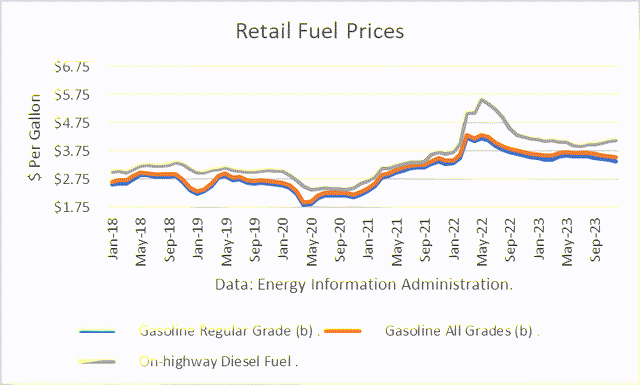
U.S. gasoline prices have surged to levels that are affecting demand in the largest oil-consuming country in the world.
EIA
And the Energy Information Administration projects in its Summer Fuels Outlook:
Based on the April 12, 2022 update to our Short-Term Energy Outlook (STEO), we currently forecast that the retail price of regular-grade gasoline will average $3.84 per gallon (gal) in the United States this summer (the second and third quarters of the year), and that retail diesel prices will average $4.57/gal. In real (inflation-adjusted) terms, gasoline and diesel prices this summer would be the highest since summer 2014. In addition, we forecast that U.S. consumption of gasoline will increase this summer but remain less than during the pre-pandemic summer of 2019. As a result, we estimate that the average U.S. household will spend about $2,945 on gasoline in 2022, which, in real terms, is $455 (18%) more than in 2021. We expect that summer 2022 U.S. diesel consumption will also increase, almost equaling consumption during the summer of 2019.
We estimate that consumption of gasoline in the United States during the first quarter of 2022 (1Q22) averaged 8.4 million b/d, up from 8.0 million b/d in 1Q21, but less than 1Q19 consumption of 9.0 million b/d. We forecast that U.S. gasoline consumption from April through September 2022, the summer driving season, will average 9.2 million b/d, up 75,000 b/d from the 2021 summer driving season, but down from 9.5 million b/d during that period in 2019.
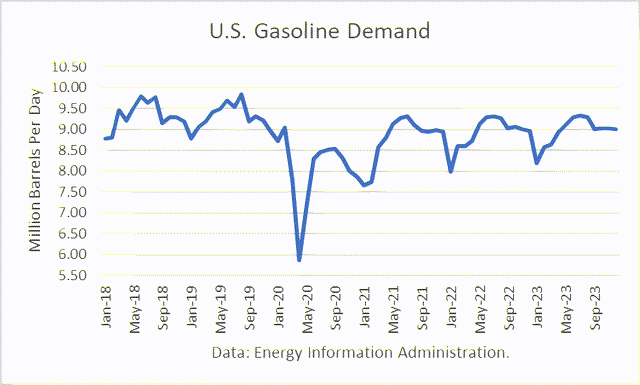
EIA
EIA
Finally, high oil prices and inflation are causing some economists to expect a recession is coming, which would adversely impact oil demand. “There is a significant likelihood of a recession in the not-too-distant,” according to economist Larry Summers, former Treasury Secretary and past president of Harvard University.
Algorithmic Trading Strategy (AT)
To view the issue from a different perspective, I applied my algorithmic trading (AT) strategy for systematic positioning, which I call the “BRS” strategy. I have discussed my development of my VRM model and AT strategies in-depth in a recent article, “BRS Crude Oil Algorithmic Trading Strategy Is Still Bullish.” Key takeaways from that article are:
• Use of a behavioral finance model developed by Nobel economics laureate, Robert Shiller,
• Use of risk management, “the essence of investment management,” according to Benjamin Graham,
• Use of maximum drawdown (“MD”) as my primary risk criterion, and
• The design and testing of my AT strategy, utilizing “In-Sample” and “Out-of-Sample” periods, “one of the very best methods available.”
The positioning of the BRS strategy for crude oil is 50% long, as of the close of May 24th.
Conclusions
Oil market exposures are highly risky at this time because the market is subject to uncertain political and economic developments of high importance. Therefore, using a behavioral finance approach makes the most sense to me. My algorithmic trading strategy is based on such an approach and currently provides a “Long” signal.
[ad_2]
Source links Google News

