")
[ad_1]
The VanEck Vectors BDC Income ETF (BIZD) invests in a wide array of business development companies in the United States. The fund offers a huge dividend yield of 9% and the underlying BDCs trade at a weighted average P/E ratio of 8.5X.
As you would expect, all of that reward comes with a fair amount of risk. BDCs often borrow money to invest in speculative-grade credit in order to maximize yields and investor interest. As a whole, I like the ETF but investors who want to minimize their risk exposure may want to look at the individual names in order to toss out the bad apples.
What is a Business Development Company
In case you have not already heard, a business development company is a firm that invests primarily in the credit of small- and medium-sized businesses. The BDC is often operated by a big asset manager such as Ares (ARES) and is traded as a separate entity/fund on the NYSE.
To a certain degree, a BDC is very similar to a REIT, or more specifically, a mortgage REIT. They have no corporate income tax so long as they distribute 90% of their taxable income in the form of dividends to investors. They are typically levered to a debt to equity of 1:1 and invest across the capital structure of small- to medium-sized companies. Some BDCs even have equity exposure to account for the fact that BDCs cannot provision for loan losses.
Put simply, buying an ETF like BIZD or investing in the individual holdings is essentially “playing banker” to the smaller companies of corporate America.
The VanEck Vectors BDC Income ETF
There are currently five ETFs that offer exposure to this unique asset class. Three are non-levered: BIZD, BDCS, and BDCZ – UBS ETRACS’s equivalents. The other two, BDCL and LBDC, have 2X leverage. Personally, adding 2X leverage on 2X levered BDCs that are invested in highly levered companies seems like a bad idea.
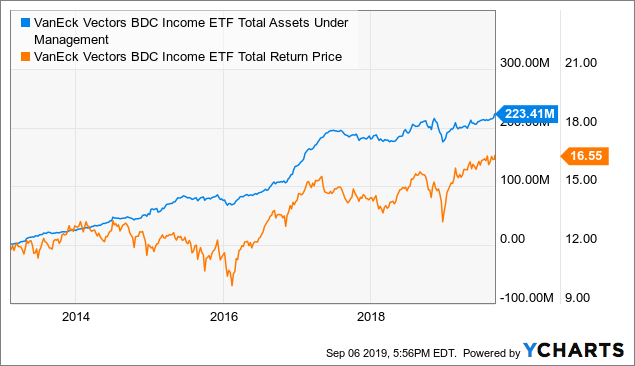
BIZD is most definitely the best of this bunch as it has the greatest liquidity and has the best unlevered performance. The fund has been trading since 2013 and currently has $223M in AUM. That relatively low AUM figure is a sign that most investors are probably unaware of the BDC asset class.
Let’s take a look at the trend of this AUM to gauge how our fellow investors are positioned:
 Data by YCharts
Investor interest has slowly but surely been climbing for the fund. This is particularly true during and immediately following periods of strong performance.
Note, I used the “total return price” above which accounts for dividend gains. As you can see, the total return of the fund has been relatively poor over the past years and has seen significant drops during periods of low liquidity.
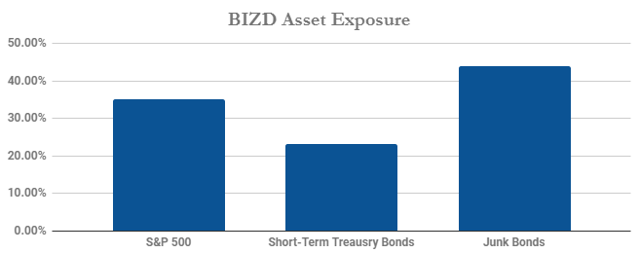
Speaking of which, let’s have a look at the fund’s asset class exposure. I do this using “multiple least squares” on the daily changes of the fund vs. that of other assets. Here are the results:
(Data Source – Google Finance)
Looking at it from this angle, the fund has less direct exposure to the equity market and high exposure to the high-yield bond market. The fund also has high exposure to the short-term treasury bond market.
For the fund to perform well, the yield curve must be steeper. The high short-term bond exposure is due to the fact that the BDCs borrow at the short-end of the curve and lend in leveraged loans. If the curve continues to invert, it could result in liquidity issues for some of the BDCs as their net interest margin would fall.
Overall, the fund offers a very nice return but is riskier than high-yield bonds. Most BDCs are invested in loans, so they are not very exposed to treasury interest rates but are heavily exposed to corporate bond spreads. BDCs with higher preferred equity exposure are highly exposed to long-term rates. We will go into this in more depth, but if corporate spreads continue to widen, it could spell trouble for the BDCs.
Estimating Risk-Reward Profile of Holdings
One of the simplest and most effective ways to analyze income funds is by dividing their dividend yield by their volatility. In my opinion, volatility is a better estimate of risk than debt ratios because the market is usually (but not always) smarter when it comes to finding true exposure. BDCs that offer high dividends and low volatility come with a higher estimated Sharpe ratio.
Below is a table of the dividend of the BDCs divided by the volatility of the fund:
| Ticker | Name | Dividend Yield | Annualized Volatility |
Dividend/Volatility |
| (TCPC) | BlackRock TCP Capital Corp. | 10.75% | 11.73% | 0.87 |
| (NMFC) | New Mountain Finance Corp. | 10.10% | 12.59% | 0.76 |
| (OXSQ) | Oxford Square Capital Corp. | 14.10% | 20.84% | 0.65 |
| (SLRC) | Solar Capital Ltd. | 8.00% | 11.69% | 0.64 |
| (OTC:AINV) | Apollo Investment Corp. | 11.01% | 16.71% | 0.63 |
| (BKCC) | BlackRock Capital Investment Corp. | 13.82% | 21.91% | 0.61 |
| (FSK) | FS KKR Capital Corp. | 12.93% | 20.96% | 0.59 |
| (PNNT) | PennantPark Investment Corp. | 11.59% | 18.87% | 0.59 |
| (GBDC) | Golub Capital BDC Inc. | 6.93% | 11.16% | 0.58 |
| (ARCC) | Ares Capital Corp. | 8.35% | 13.63% | 0.58 |
| (FDUS) | Fidus Investment Corp. | 10.61% | 17.57% | 0.58 |
| (PSEC) | Prospect Capital Corp. | 11.04% | 19.25% | 0.55 |
| (PFLT) | PennantPark Floating Rate Capital Ltd. | 9.82% | 17.11% | 0.54 |
| (TSLX) | TPG Specialty Lending Inc. | 7.49% | 12.83% | 0.54 |
| (CGBD) | TCG BDC Inc. | 10.40% | 18.28% | 0.54 |
| (TPVG) | TriplePoint Venture Growth BDC Corp. | 8.79% | 19.54% | 0.42 |
| (HTGC) | Hercules Capital Inc. | 9.45% | 22.17% | 0.40 |
| (OCSL) | Oaktree Specialty Lending Corp. | 7.28% | 16.95% | 0.40 |
| (GSBD) | Goldman Sachs BDC Inc. | 6.93% | 17.51% | 0.37 |
| (GAIN) | Gladstone Investment Corp. | 6.87% | 18.80% | 0.34 |
| (MAIN) | Main Street Capital Corp. | 5.48% | 15.25% | 0.33 |
| (NEWT) | Newtek Business Services Corp. | 8.12% | 24.00% | 0.32 |
| (BBDC) | Barings BDC Inc. | 4.00% | 12.31% | 0.28 |
| (GLAD) | Gladstone Capital Corp. | 5.16% | 17.11% | 0.27 |
| (BCSF) | Bain Capital Specialty Finance Inc. | 6.60% | 22.53% | 0.27 |
Note, volatility measured as the annualized standard deviation of returns over the past 12 months.
(Data Source – Google Finance)
Looking at it from this angle, we can clearly see that some of these BDCs are a better deal than others. The best funds on this measurement today is BlackRock’s TCPC and New Mountain Finance Corp.
In general, the BDCs with higher volatility have higher dividend yields. This is seen well on Oxford Square Capital Corp. (OXSQ) which pays a huge dividend yield of 14% but has extremely high volatility. That said, there are funds like Bain’s BCSF that has very high volatility and offers little in dividends.
Estimating Credit Risk
The primary risk to BIZD is high yield credit spreads. From January 2013 to 2014, the principal value of BIZD fell from $21 to $15 or by roughly a third. During the same time, B corporate credit spreads (average B current yield minus LIBOR) rose from roughly 4.1% to a peak of nearly 7.9%. Thus, I estimate that the fund’s value will fall by about 9% for every 1% increase in B credit spreads (any spread could be used, but I assume B is the clearest estimator).
Today, the B spread is 4.4% and is down from 5.9% at the beginning of the year. The spread has changed by 1.5%; using my above estimator, we can multiply that 1.5 X 9% = a 13.5% expected price appreciation. Accordingly, BIZD is up about 15% on the year. This metric offers a very useful way of estimating the risk in BIZD given a major credit event as in 2008 or 2000.
B spreads rose about 5% from 1998 to 2001 which would estimate a nearly 50% principal loss for BIZD. As an extreme (and less likely) example, they rose 16% from 2007 to 2009. Fortunately, the estimation system breaks down at such an extreme, but many BDCs in BIZD saw principal value fall around 75% peak to trough over that period.
Luckily, B spreads have been pretty stable this year, but CCC spreads are on an uptrend and may drag the lower risk spreads up along with it. Take a look below:
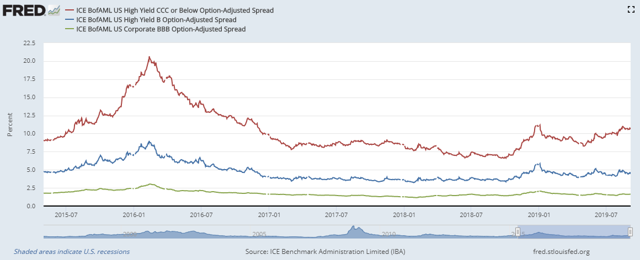
(Source – Federal Reserve Economic Database)
If this trend bleeds into the other corporate spreads, it could spell trouble for the ETF.
The Bottom Line
Overall, the wide variety of risk-reward profiles for the underlying BDCs make BIZD itself a pretty unattractive investment because results would probably be better among individual names. The reality is that a BDC itself is already heavily diversified across tens to hundreds of companies so there is not much diversification value from the ETF. Even more, you have to pay an extra management fee to the ETF provider.
Still, BIZD is a good benchmark for the asset class and, for investors who want as much diversification as possible, could be a good investment. Because of the slowly growing credit risk, I will give BIDZ a “hold” rating. On the other hand, TCPC and NMFC could be a good choices given their low volatility and high yield and deserve a solid “buy” rating.
Interested In Closely Following Global Events?
“The Country Club” is a dedicated service that focuses on single-country and regional ETFs with the goal of helping our subscribers diversify globally and get a better grasp on how world events will affect their portfolio. We will certainly be providing subscribers further updates on this idea.
Subscribers receive exclusive ideas, model portfolios, and a wide range of tools including our exclusive “Country Club Dashboard” which allows them to visualize global financial and economic data. If you haven’t already, please consider our 2-week free trial and get your passport to global markets today!

Disclosure: I/we have no positions in any stocks mentioned, and no plans to initiate any positions within the next 72 hours. I wrote this article myself, and it expresses my own opinions. I am not receiving compensation for it (other than from Seeking Alpha). I have no business relationship with any company whose stock is mentioned in this article.
[ad_2]
Source link Google News