
[ad_1]
(Pic sourced here)
It’s official, we’ve reached that point in the market cycle where it’s impossible to ignore articles with titles like “Seven Stocks to Avoid” or “How to Survive the Coming Recession.” We’re not fans of clickbait titles but what really gets under our skin is the fact that almost every one of these articles rehashes some piece of “common wisdom” usually telling you to sell all your tech stocks and hide out with dividend payers like consumer staples or better yet, utilities. Instead we’d argue that whether because of their lofty valuations or exposure to ETF flows, investors need to be just as wary of utility stocks as tech stocks and that they might not offer the protection investors require when the market inevitably turns.
No Discounts for Safety
We know arguing that you need to beware of utilities stocks is a hard sell, even after a great run that has the Utilities Select Sector SPDR ETF (XLU) up over 26% in the last year compared to the S&P 500’s just under 6% return and making them the best performing sector. Best of all, even after their recent run-up, most utility funds are still trading at a discount to their high growth brethren. For all its sideways trading, SPY (standing in for the S&P 500) has a trailing P/E ratio of 19.5X compared to 20.88x for the Technology Select Sector SPDR ETF (XLK) while defensive favorite XLU is all the way back at 17.58x. Some would call that a relative bargain!
And they might be right, but if you look at how richly priced XLU is compared to its own price history, you get a very different picture of the situation. We use historical price multiples to calculate our ETFG Fundamental Quant score, and when it comes to the P/E multiple, XLU is trading at all-time highs relative to its own past. That may sound pretty extreme until you consider that 59 of the 84 public utility stocks are trading at P/E multiples above that of the S&P 500.
Nor is that the only metric showing extreme valuations, XLU’s price-to-book ratio is now in the top 5th percentile, something it has in common with XLK and the growth-oriented segments of the S&P 500. And it’s not the only utility fund trading at high levels, with the iShares U.S. Utilities ETF (IDU) and the Vanguard Utilities ETF (VPU) also trading close to historically high multiples. And the long-anticipated bear market hasn’t even begun yet.
What’s brought utility funds to this level of lofty valuations? There have been serious inflows into utility funds over the last year, with the largest, XLU, taking in over $1.5 billion in new assets while VPU and IDU have seen smaller flows of $700 and $150 million, respectively, but that’s only part of a bigger problem. Of those 84 publicly traded domestic utility companies, maybe 70 of those would meet the normal standards to be included in an ETF index with a combined market cap of over $1 trillion. That’s hardly a narrow range of companies to choose from and combine that with the fact that there are only 10 dedicated utility ETFs with just over $12 billion in assets and it becomes obvious that inflows into utility funds aren’t the only problem.
Instead, we’d argue a much bigger problem is who else are big holders of utility stocks with both the passive index replicators and any number of smart beta funds, including low volatility and high dividend that are natural buyers of utility stocks, making them highly susceptible to fund flows. That combination could mean a lot of trouble for investors, whether they’re buying single stock names or ETFs, who think utilities are an easy answer for troubled times.
Can WTR Keep Flowing Uphill?
One stock where you can clearly see this combination in action is Aqua America Inc. (WTR), one of the top performers in the utilities space this year with a return above 21% through June 14th compared 14.4% for IDU, one of the funds that holds it. We’ll be honest, even with the cool ticker, WTR wasn’t on our radar, or that of many investors we’d suspect, as it has just over 15k followers on Seeking Alpha, roughly the same as IDU and half of what the largest publicly-traded utility in America, NextEra Energy (NEE), has following it. Then again, utilities as a whole are one of the sleepier corners of the investment world, although you wouldn’t know that from looking at this chart of WTR.
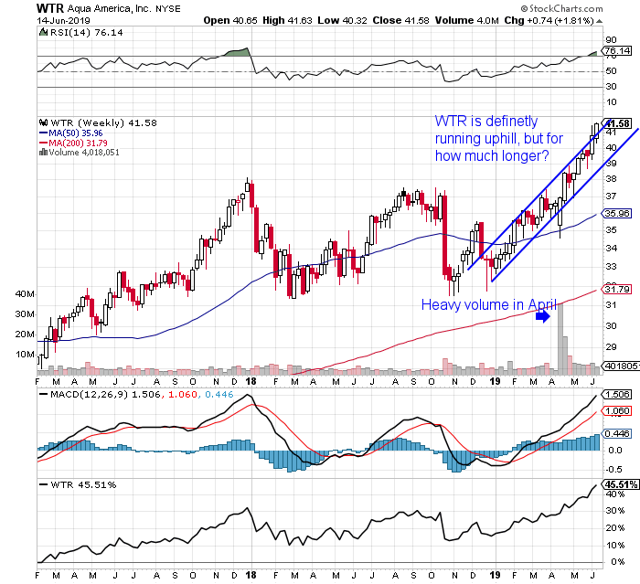
Clearly, there were some investors who haven’t been ignoring the company’s potential as it outperforms the sector funds while advancing in a strong uptrend channel. Then again, WTR’s price isn’t the only thing in a strong uptrend as the company is also trading with a TTM P/E multiple of 46.6 and a dividend yield of just over 2.1%. Compare that to 21.92x and a dividend yield of 2.6% for IDU and it’s easy to wonder how the valuations for WTR got this high. To answer that, we need to consider some of the details from our ETF fund reports.
When comparing the changes in ETF stock ownership from the end of April to the end of May, we noticed a peculiar thing about WTR that helped us connect a lot of dots on why so many “defensive” funds are trading close to peak multiples. At the end of May, WTR had nearly 45 million of its shares held by different ETFs, a 7.3% increase from the end of April and which was roughly 1.4% of its total shares outstanding. We expect slow reporting by Vanguard is behind some of that increase, but even going back to Dec. 21, 2018, there is an increase in WTR shares held by ETFs of over 7 million, which is more than 4x the stock’s average daily trade volume.
Even more startling was that those 45 million shares held by ETFs equaled more than 20% of WTR’s outstanding shares. That’s a large chunk even in the $5 billion to $10 billion market cap space WTR currently finds itself in where ETF ownership might be in the low-to-mid teens. Nor is this unique to WTR, there are multiple utility stocks of a similar size compared to WTR with high comparable ETF ownership, making them highly susceptible to shifts in investor sentiment and fund flows.

The culprit isn’t strong inflows into utility funds, although they have pulled in a decent amount of new assets in 2019, nor is it the concentrated nature of the industry. That’s especially true for WTR, which isn’t included in the largest utility ETF, XLU, and is less than a 1% holding in both IDU and VPU. In fact, utility funds only hold 3% of the total shares held by ETFs which is less than the amount held by funds we categorize as ‘Natural Resource’ funds. So who does hold down the biggest amount of WTR?
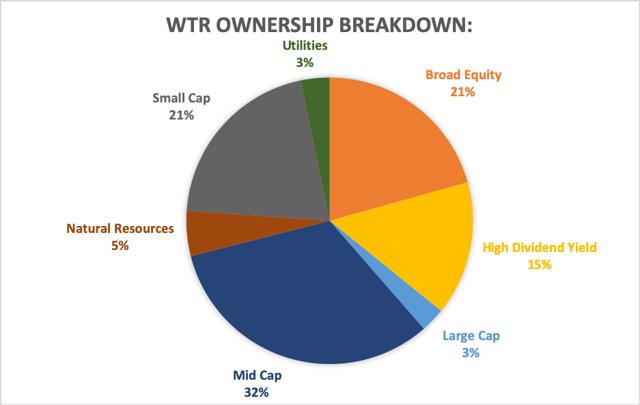
As of June 11th, it’s mid-cap/small-cap index funds followed by ‘Broad Market’ funds like the Vanguard Total Stock Market ETF (VTI) and then high dividend yield funds with more than 15% with just one fund, the SPDR S&P Dividend ETF (SDY), accounting for more than 10% of WTR’s shares held by ETFs. And after going back to our constituents file for Dec. 31, 2018, we could see that SDY has been an accumulator of WTR’s stock this year, picking up an additional half-million shares. So has the Invesco S&P MidCap Low Volatility ETF (XMLV) which has bought another 200k, although they’re only small parts of a much larger total.
What’s helped drive WTR to almost nose-bleed valuations isn’t a new fund or strong inflows into dividend ETFs, but the fact that utilities in general are doing so much better than the broader market, forcing passive index funds to increase their allocations. After all, if one segment of the market is strongly positive while others are flat-to-down, then stocks in that hot sector will see their weighting in a market replicator steadily rise over time. Anyone who has seen a list of the tech stocks at the top of the S&P 500 doesn’t need that explained to them and that’s helped push WTR higher.
The single biggest holder of WTR is the iShares Core S&P MidCap ETF (IJH) which replicates the S&P 400 Mid-Cap Index, and as of June 11 had over 6.1 million shares of WTR, a 1.1 million increase from the end of 2018. The fund has picked up some new assets so far in 2019, roughly $1 billion, but the real story is that WTR’s allocation has steadily increased in the fund, rising from .41% at the start of the year to just over .51% now. And a .51% allocation combined with their $48.85 billion in AUM buys you a lot of WTR.
WTR’s move higher isn’t just about an influx of new investors, or strong cash flows into sector funds, it’s the fact that large index funds have relatively stable assets and have been acquiring more shares as the rest of the market withers. That’s led to a substantial increase in ETF ownership of utility shares, and in their prices, but how much longer can that endure? Or more importantly, can it endure a sustained correction?
In fact, WTR’s market cap is now approaching the level where some might wonder if it naturally belongs in the S&P 500 rather than the mid-cap index. After all, it’s already higher than a number of S&P 500 components, and with significantly more assets linked to it, shifting to the large-cap S&P 500 would lead to a serious inflow into WTR. Then again, it would still be significantly smaller than any other utility stock, although that’s not the key lesson we hope you take away from this.
Conclusions:
Instead, given how high the ETF ownership of not just WTR, but any number of utility stocks, has become, investors need to be very careful about how they approach investing in the sector, especially those using an ETF. While the sector is somewhat concentrated, there is a significant difference in the holdings between large-cap XLU (which only uses S&P 500 components), and VPU and IDU which are more diversified. But their larger portfolios include many of the smaller names like WTR which are more vulnerable to ETF inflows.
Nor are single stock investors in the space likely to escape any fallout if investors decide to leave the market en masse. As we’ve shown, utility funds are relatively small holders of the actual stocks in that sector and can’t be expected to soak up the shares being cast off from index funds if investors decide to liquidate their core holdings. Even trying to find relatively “lightly owned” companies in the sector is likely to prove a forlorn hope given its somewhat concentrated nature.
Nor are utility investors the only ones who should beware as certain dividend and low-volatility funds are overweight utility stocks, including both VIG and SDY which are also trading at historically high multiples. The best advice anyone can offer might be to think carefully about why you’re buying defensive funds in the first place, especially given their low yields, and whether a short-term bond fund or other cash alternative might be a better short-term choice.
Disclosure: I/we have no positions in any stocks mentioned, and no plans to initiate any positions within the next 72 hours. I wrote this article myself, and it expresses my own opinions. I am not receiving compensation for it (other than from Seeking Alpha). I have no business relationship with any company whose stock is mentioned in this article.
Additional disclosure: Assumptions, opinions and estimates constitute our judgment as of the date of this material and are subject to change without notice. ETF Global LLC (“ETFG”) and its affiliates and any third-party providers, as well as their directors, officers, shareholders, employees or agents (collectively ETFG Parties) do not guarantee the accuracy, completeness, adequacy or timeliness of any information, including ratings and rankings and are not responsible for errors and omissions or for the results obtained from the use of such information and ETFG Parties shall have no liability for any errors, omissions, or interruptions therein, regardless of the cause, or for the results obtained from the use of such information. ETFG PARTIES DISCLAIM ANY AND ALL EXPRESS OR IMPLIED WARRANTIES, INCLUDING, BUT NOT LIMITED TO ANY WARRANTIES OF MERCHANTABILITY, SUITABILITY OR FITNESS FOR A PARTICULAR PURPOSE OR USE. In no event shall ETFG Parties be liable to any party for any direct, indirect, incidental, exemplary, compensatory, punitive, special or consequential damages, costs, expenses, legal fees, or losses (including, without limitation, lost income or lost profits and opportunity costs) in connection with any use of the information contained in this document even if advised of the possibility of such damages.
ETFG ratings and rankings are statements of opinion as of the date they are expressed and not statements of fact or recommendations to purchase, hold, or sell any securities or to make any investment decisions. ETFG ratings and rankings should not be relied on when making any investment or other business decision. ETFG’s opinions and analyses do not address the suitability of any security. ETFG does not act as a fiduciary or an investment advisor. While ETFG has obtained information from sources they believe to be reliable, ETFG does not perform an audit or undertake any duty of due diligence or independent verification of any information it receives.
This material is not intended as an offer or solicitation for the purchase or sale of any security or other financial instrument. Securities, financial instruments or strategies mentioned herein may not be suitable for all investors. Any opinions expressed herein are given in good faith, are subject to change without notice, and are only correct as of the stated date of their issue. Prices, values, or income from any securities or investments mentioned in this report may fall against the interests of the investor and the investor may get back less than the amount invested. Where an investment is described as being likely to yield income, please note that the amount of income that the investor will receive from such an investment may fluctuate. Where an investment or security is denominated in a different currency to the investor’s currency of reference, changes in rates of exchange may have an adverse effect on the value, price or income of or from that investment to the investor.
[ad_2]
Source link Google News