[ad_1]

bfk92/E+ via Getty Images
Introduction
The Direxion Daily Aerospace & Defense Bull 3X Shares (NYSEARCA:DFEN), is a leveraged ETF designed to earn three times the daily return of the Aerospace & Defense industry index. As such, it is mostly used by traders for short term speculative gains.
In this article I show by way of a few simple examples, that leveraged funds may be used by investors for enhancing the performance of their portfolios.
Example #1: Long-Term Investing
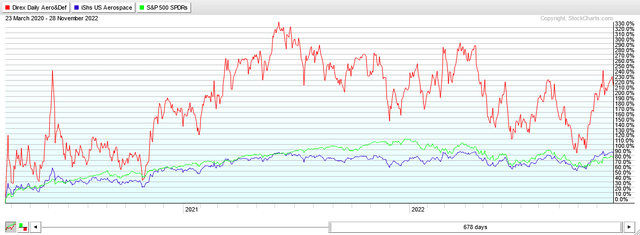
Assume that in March 2020 an investor decided to buy DFEN and hold it long-term. How would that investor have done by staying invested for the whole time?
The chart below shows the total return, including dividends, of three funds: DFEN, ITA and SPY. ITA is the non-leveraged ETF for the Aerospace & Defense industry.
The returns are as follow: DFEN (220.42%), ITA (92.44%), SPY (84.35%). DFEN has returned 2.38 times the return of the non-leveraged ITA fund. That is much less than 3 times, but it is still a substantial gain.
One caveat: The DFEN equity curve shows huge price oscillations. If an investor could stomach such a wild ride, then investing in DFEN was the most profitable choice.
stockcharts.com
Example #2: YTD Bear Market
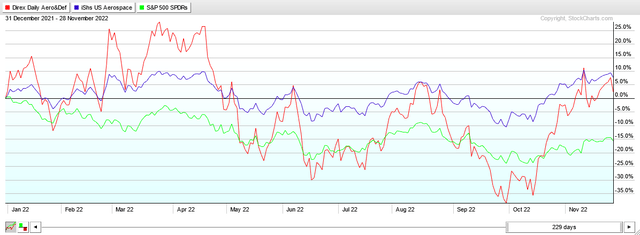
The next chart shows the performance of DFEN since January 1st 2022 until November 28.
The returns are as follows: DFEN (2.36%), ITA (7.70%), SPY (-15.68%). The Aerospace & Defense industry has done much better than the broad market. In fact, ITA traded in a small range over the whole year. DFEN has returned much less than the non-leveraged fund. This shows that when the non-leveraged index trades in a range, the leveraged fund suffers a compounding decay. Clearly, the investor would have done better by staying invested in the non-leveraged fund.
stockcharts.com
Example #3: Bear Market Rally (uptrend)
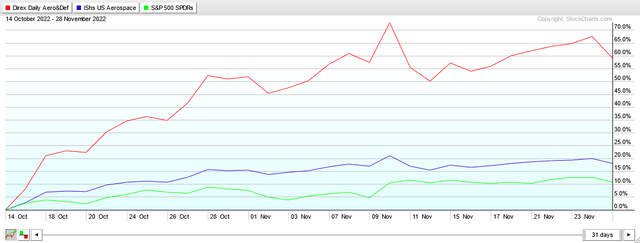
The next chart shows the performance of DFEN since October 14 2022 until November 28.
The returns are as follow: DFEN (59.17%), ITA (17.98%), SPY (10.70%).
During this rally, DFEN has returned 3.29 times the return of ITA. This example shows that during uptrends the compounding of 3x returns produces additional gains. The symmetric behavior happens during downtrends, when compounding leveraged losses produces losses in excess of the 3 times of non-leveraged loss.
stockcharts.com
Example #4: Bear Market Crash
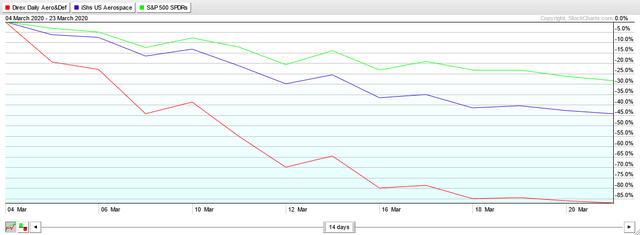
Chart from March 4, 2020 to March 23, 2020.
The returns are as follow: DFEN (-87.03%), ITA (-44.36%), SPY (-28.32%).
During the three week COVID market crash, DFEN has lost so much that it would need a gain of 671% to recover from it. For comparison, the non-leveraged ITA would require a gain of 79.72% and SPY a gain of 39.51%.
stockcharts.com
Current Market Environment
The current market environment is positive for DFEN. There are two main factors that support taking a long position.
First, the broad market is in bear market rally since the middle of October. Due to market seasonality, i.e. Christmas rally, it is expected that this rally is likely going to last at least to the end of December.
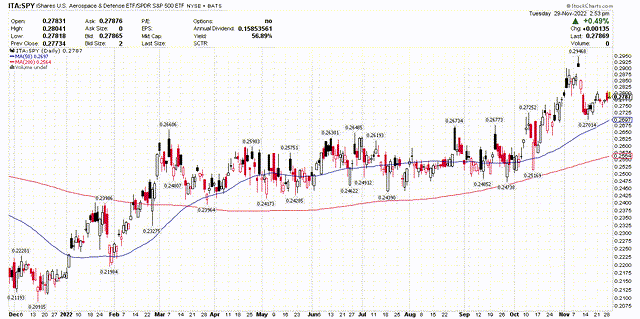
Second, the Aerospace & Defense industry outperformed the broad market for the whole 2022 year. See the graph below. The current geopolitical situation, including the war in Ukraine, favors the continuation of this trend.
stockcharts.com
Conclusion
I rate DFEN as a BUY for a trade lasting to the end of the year.
[ad_2]
Source links Google News

