[ad_1]

JHVEPhoto/iStock Editorial via Getty Images
The Cambria Global Momentum ETF (BATS:GMOM) is an around $125 million actively managed ETF targeting exchange-traded funds demonstrating resilient momentum.
The U.S. equity universe does not constrain its strategy, instead, the fund can also venture into the fixed income, foreign stocks, currency, and commodity cohorts, which allows it to maximize returns when domestic stocks have slack days, with 2022 perhaps being the perfect example. The dataset I downloaded from its website shows 12 ETFs in its portfolio, with the top three accounting for over 35% of the net assets.
On the downside, even though the strategy looks fairly lucrative given portfolio management flexibility secured by the active approach and power of the momentum factor, there are two solid vulnerabilities that make the ETF a pass. First, its past performance is far from spotless. In fact, we see years and years of underperformance, with only 2022 being a silver lining as the fund correctly identified the early hawkish era market darlings principally from the pro-inflation echelon, but yet with caveats discussed below. Second, GMOM is not for cost-averse investors, with burdensome fees of 96 bps, which is more than 2x higher than the median in the ETF universe covered by the Seeking Alpha rating. Expenses will erase a solid deal of gains over the long term. In sum, owing to poor returns and heavy fees, I see little to no reason to invest in GMOM.
Delving into the investment strategy
GMOM navigates the shifting tides of market sentiment by rotating from one set of vehicles to another, selecting the top one-third of plays exhibiting robust “short to long term trailing momentum” from a universe of around 50 ETFs.
As explained in the methodology, its portfolio is updated monthly, with approximately 17 names selected. As I said above, the most recent version contains 12 funds.
In the current iteration, we see a meaningful share of GMOM’s assets is invested in the U.S.-focused Cambria Value and Momentum ETF (VAMO), 13.6%. We also highlight large exposure to the U.S. fixed income, with almost 24% allocated to the Schwab US TIPS Bond ETF (SCHP), iShares 1-3 Year Treasury Bond ETF (SHY), and iShares Short Treasury Bond ETF (SHV). Besides, via its position in the Cambria Tail Risk ETF (TAIL), GMOM has indirect exposure to the U.S. Treasury Bond 0.625 05/15/2030 and the United States Treasury Inflation Indexed Bonds 0.125 07/15/2030 that together account for over 84% of TAIL’s net assets.
The fund also has a footprint in equities deemed defensive via the iShares Global Utilities ETF (JXI), though their impact on its returns is not that significant owing to just around 6.6% weight. Please do note that JXI does bear some FX risk due to its pound sterling, the euro- and other developed world currencies-denominated investments, slightly above 33% of the net assets.
Since the fund has an active strategy, these allocations are certainly not set in stone. For instance, comparing its holdings from August 30 and May 6 using data saved by the Wayback Machine, I noticed that material shifts happened in just a few months. Specifically, since May, GMOM has exited the Invesco DB Agriculture Fund (DBA) and also eliminated its exposure to gold plays like VanEck Gold Miners ETF (GDX), GraniteShares Gold Trust (BAR), and Invesco DB Precious Metals Fund (DBP), to name a few.
Returns: Betting on racier assets did not yield superior returns
The major problem with the ETF is its returns. Incepted in November 2014, it underperformed the iShares Core S&P 500 ETF (IVV) every single year, except for 2014 (measured using only December data) and 2022 to date (excluding August). And since in most cases IVV’s returns were higher by double digits or high single digits, we certainly cannot say that only the burdensome fees were the essential detractors. More likely, it was due to imperfect strategy.

Created by the author using data from Portfolio Visualizer
As can be seen in the table above, 2019 was the toughest, when it underperformed the S&P 500 ETF by around 23%. Also, in 2018, the only year over the period discussed when IVV finished in the red, GMOM also had a lackluster performance, finishing with an even weaker result. During the pandemic, it failed to capitalize on the U.S. tech momentum, again lagging behind the bellwether ETF. And in 2021, when the vaccine-induced capital rotation engendered the cyclicals rally, GMOM failed to keep pace once again.
I would say it is worth paying special attention to in 2022. As my dear readers can see, GMOM has outperformed IVV every month barring July, when the risk-on sentiment returned for a moment bolstered by the bad news is a good news narrative, lifting share prices of battered tech heavyweights and the like. In my view, the fund had correctly identified the stars of the 2022 market (for now), namely energy and natural resources that are deemed pro-inflation plays that supercharged its outstanding returns before the steep price decline in the summer. However, incorporating the total return delivered over August, GMOM is still way ahead of IVV despite a sluggish July.
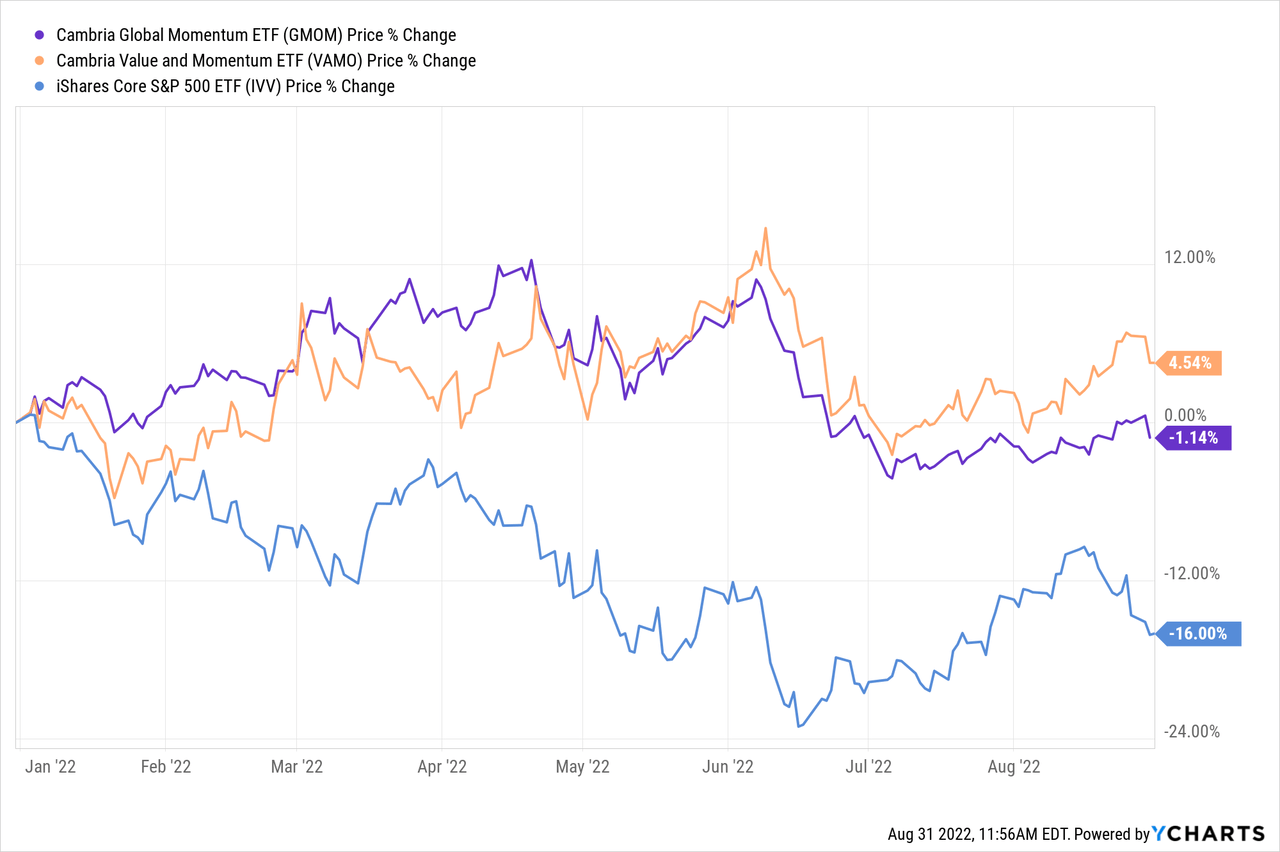
A few of my dear readers can justly riposte here that comparing a multi-class momentum ETF with the S&P 500 or a U.S.-focused equity fund is nonsensical since, for example, this approach ignores FX tailwinds/headwinds. Though I disagree, I still think it is still worth incorporating more insights for better context.
Below, I compare GMOM with iShares MSCI Intl Momentum Factor ETF (IMTM), a pure-equity vehicle tracking the MSCI World ex USA Momentum Index. The period selected is shorter owing to IMTM’s shorter trading history (incepted on 13 January 2015).

Created by the author using the data from Portfolio Visualizer
The results speak for themselves. With a few bright spots in the past, GMOM’s strategy outshined IMTM this year, owing to, in my view, its much smaller exposure to the FX factor, while the international ETF was impacted by the depreciation of the pound sterling, Canadian dollar, yen, and other currencies amid the USD rally.
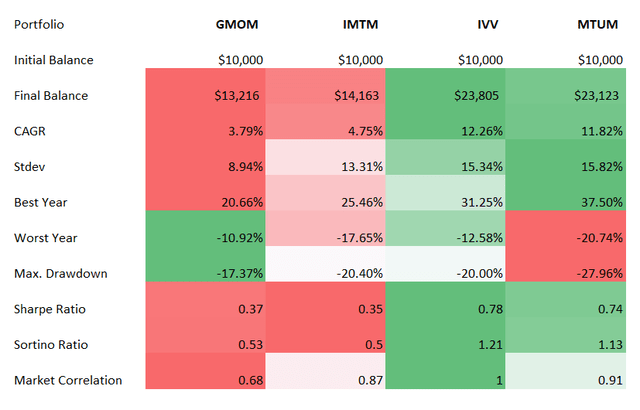
Now, a bit more color in terms of CAGRs, volatility, risk-adjusted returns, and correlation with the U.S. market. The two tables below are for two peer groups, with and without IMTM which has the shortest trading history among the funds selected.
Created by the author using data from Portfolio Visualizer
In the first group (the period measured includes February 2015 – July 2022), GMOM’s only advantage is the lowest volatility together with the max drawdown being less deep compared to the peers selected. It also should be noted that its correlation with the U.S. market is the lowest. Yet a CAGR and risk-adjusted returns are fairly dismal.
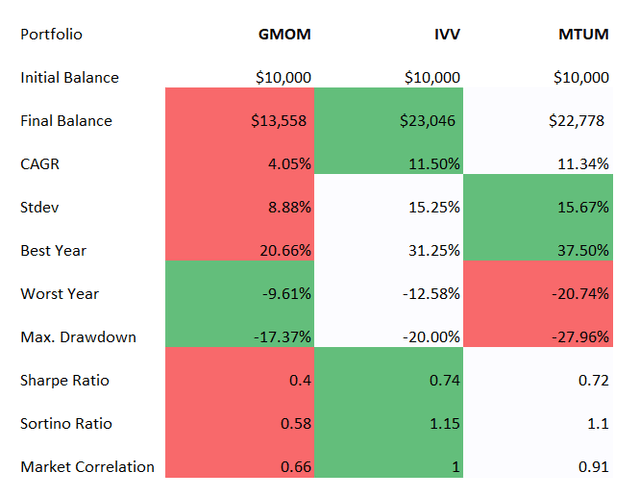
The next table compares its returns from December 2014 to July 2022 to IVV and the iShares MSCI USA Momentum Factor ETF (MTUM). Again, it barely has an edge over the U.S. bellwether fund and the U.S. equity momentum play, with the lackluster CAGR, yet with volatility again being the lowest, which still did not allow it to deliver more attractive Sharpe, Sortino ratios.
Created by the author using data from Portfolio Visualizer
Final thoughts
As I outlined in my April note on MTUM, betting on winners to continue delivering outsized returns can be at times an exceedingly lucrative strategy yielding massive benefits. The problem with this approach is that “momentum shines until it does not.” This perfectly applies to GMOM, which saw prolonged periods of softness in the past, with only 2022 being the silver lining. Perhaps, the selection pool of around 50 ETFs is too small; perhaps, monthly rebalancing is not enough.
Certainly, advantages do exist, including its low correlation with the U.S. market and comparatively lower volatility. Yet these do not make it a Buy as the fund was consistently underdelivering in the past. Meanwhile, its fees are exceedingly burdensome, which will be a solid detractor over the long term. In sum, I see no reason to buy into the ETF.
[ad_2]
Source links Google News

